Immigrants from Russia vs French Canadian Median Earnings
COMPARE
Immigrants from Russia
French Canadian
Median Earnings
Median Earnings Comparison
Immigrants from Russia
French Canadians
$53,457
MEDIAN EARNINGS
100.0/ 100
METRIC RATING
29th/ 347
METRIC RANK
$46,026
MEDIAN EARNINGS
36.1/ 100
METRIC RATING
190th/ 347
METRIC RANK
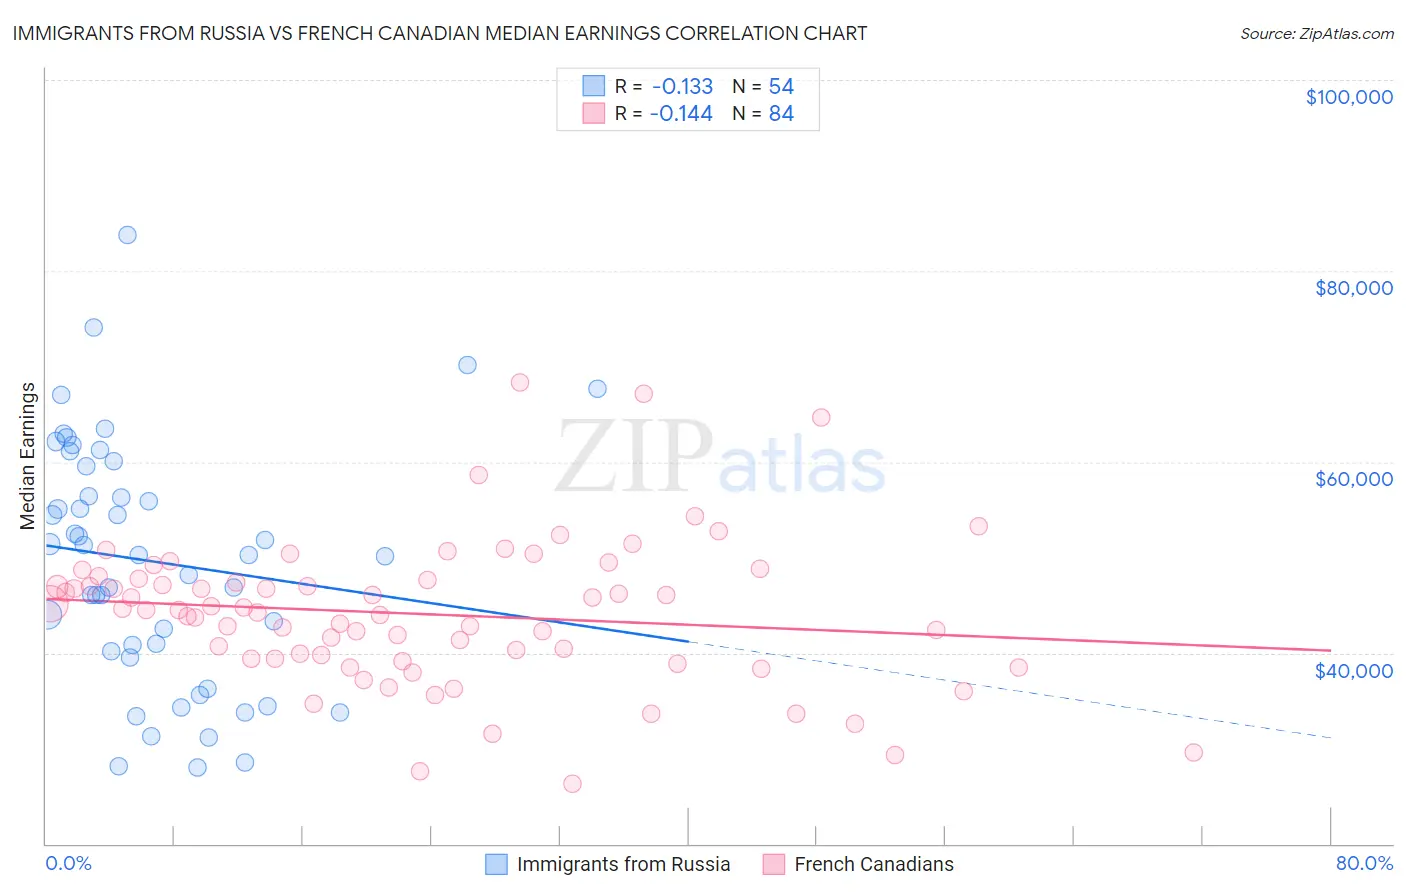
Immigrants from Russia vs French Canadian Median Earnings Correlation Chart
The statistical analysis conducted on geographies consisting of 347,936,772 people shows a poor negative correlation between the proportion of Immigrants from Russia and median earnings in the United States with a correlation coefficient (R) of -0.133 and weighted average of $53,457. Similarly, the statistical analysis conducted on geographies consisting of 502,564,111 people shows a poor negative correlation between the proportion of French Canadians and median earnings in the United States with a correlation coefficient (R) of -0.144 and weighted average of $46,026, a difference of 16.2%.
Median Earnings Correlation Summary
| Measurement | Immigrants from Russia | French Canadian |
| Minimum | $27,990 | $26,346 |
| Maximum | $83,702 | $68,284 |
| Range | $55,712 | $41,938 |
| Mean | $49,525 | $44,063 |
| Median | $50,229 | $44,489 |
| Interquartile 25% (IQ1) | $40,169 | $39,382 |
| Interquartile 75% (IQ3) | $59,535 | $47,671 |
| Interquartile Range (IQR) | $19,366 | $8,289 |
| Standard Deviation (Sample) | $12,722 | $7,666 |
| Standard Deviation (Population) | $12,603 | $7,620 |
Similar Demographics by Median Earnings
Demographics Similar to Immigrants from Russia by Median Earnings
In terms of median earnings, the demographic groups most similar to Immigrants from Russia are Immigrants from France ($53,490, a difference of 0.060%), Cambodian ($53,386, a difference of 0.13%), Russian ($53,334, a difference of 0.23%), Immigrants from Asia ($53,310, a difference of 0.28%), and Immigrants from Greece ($53,282, a difference of 0.33%).
| Demographics | Rating | Rank | Median Earnings |
| Immigrants | Korea | 100.0 /100 | #22 | Exceptional $54,530 |
| Immigrants | Sweden | 100.0 /100 | #23 | Exceptional $54,478 |
| Soviet Union | 100.0 /100 | #24 | Exceptional $54,290 |
| Turks | 100.0 /100 | #25 | Exceptional $53,919 |
| Immigrants | Northern Europe | 100.0 /100 | #26 | Exceptional $53,872 |
| Asians | 100.0 /100 | #27 | Exceptional $53,690 |
| Immigrants | France | 100.0 /100 | #28 | Exceptional $53,490 |
| Immigrants | Russia | 100.0 /100 | #29 | Exceptional $53,457 |
| Cambodians | 100.0 /100 | #30 | Exceptional $53,386 |
| Russians | 100.0 /100 | #31 | Exceptional $53,334 |
| Immigrants | Asia | 100.0 /100 | #32 | Exceptional $53,310 |
| Immigrants | Greece | 100.0 /100 | #33 | Exceptional $53,282 |
| Immigrants | Sri Lanka | 100.0 /100 | #34 | Exceptional $53,268 |
| Immigrants | Switzerland | 100.0 /100 | #35 | Exceptional $53,211 |
| Immigrants | Denmark | 100.0 /100 | #36 | Exceptional $53,186 |
Demographics Similar to French Canadians by Median Earnings
In terms of median earnings, the demographic groups most similar to French Canadians are Spaniard ($46,059, a difference of 0.070%), Immigrants from Armenia ($46,094, a difference of 0.15%), Finnish ($45,940, a difference of 0.19%), German ($45,935, a difference of 0.20%), and Guamanian/Chamorro ($45,933, a difference of 0.20%).
| Demographics | Rating | Rank | Median Earnings |
| French | 45.2 /100 | #183 | Average $46,296 |
| Immigrants | Kenya | 42.4 /100 | #184 | Average $46,214 |
| Uruguayans | 41.6 /100 | #185 | Average $46,190 |
| Vietnamese | 40.9 /100 | #186 | Average $46,172 |
| Iraqis | 39.9 /100 | #187 | Fair $46,140 |
| Immigrants | Armenia | 38.3 /100 | #188 | Fair $46,094 |
| Spaniards | 37.2 /100 | #189 | Fair $46,059 |
| French Canadians | 36.1 /100 | #190 | Fair $46,026 |
| Finns | 33.4 /100 | #191 | Fair $45,940 |
| Germans | 33.2 /100 | #192 | Fair $45,935 |
| Guamanians/Chamorros | 33.2 /100 | #193 | Fair $45,933 |
| Immigrants | Costa Rica | 33.0 /100 | #194 | Fair $45,928 |
| Immigrants | St. Vincent and the Grenadines | 32.4 /100 | #195 | Fair $45,908 |
| Yugoslavians | 30.5 /100 | #196 | Fair $45,846 |
| Barbadians | 30.5 /100 | #197 | Fair $45,846 |