Immigrants from Caribbean vs Immigrants from Scotland Householder Income Over 65 years
COMPARE
Immigrants from Caribbean
Immigrants from Scotland
Householder Income Over 65 years
Householder Income Over 65 years Comparison
Immigrants from Caribbean
Immigrants from Scotland
$48,535
HOUSEHOLDER INCOME OVER 65 YEARS
0.0/ 100
METRIC RATING
338th/ 347
METRIC RANK
$66,620
HOUSEHOLDER INCOME OVER 65 YEARS
99.7/ 100
METRIC RATING
52nd/ 347
METRIC RANK
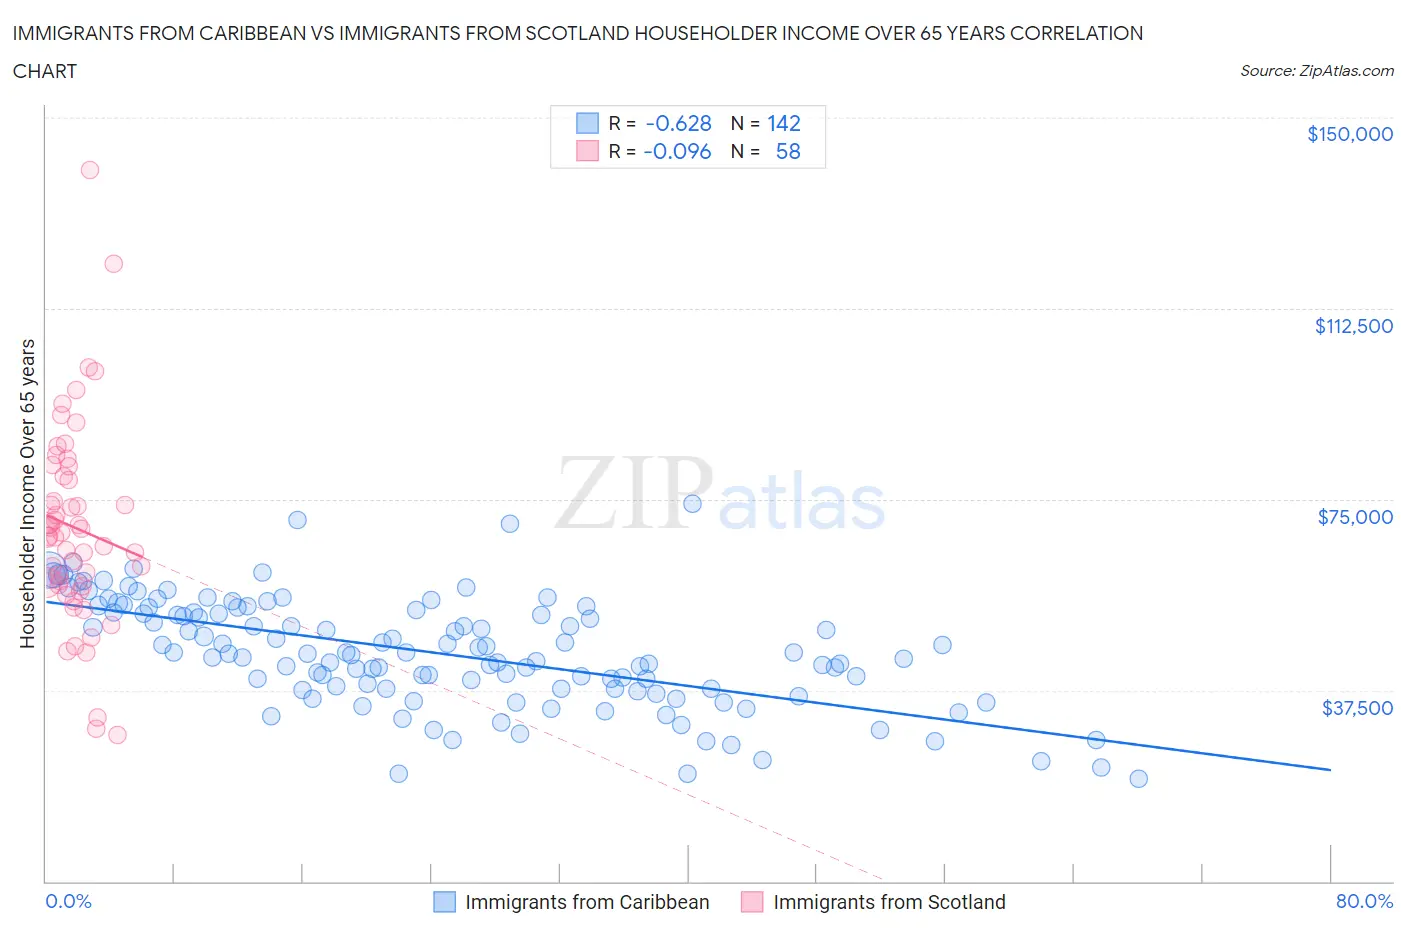
Immigrants from Caribbean vs Immigrants from Scotland Householder Income Over 65 years Correlation Chart
The statistical analysis conducted on geographies consisting of 447,788,854 people shows a significant negative correlation between the proportion of Immigrants from Caribbean and household income with householder over the age of 65 in the United States with a correlation coefficient (R) of -0.628 and weighted average of $48,535. Similarly, the statistical analysis conducted on geographies consisting of 196,236,719 people shows a slight negative correlation between the proportion of Immigrants from Scotland and household income with householder over the age of 65 in the United States with a correlation coefficient (R) of -0.096 and weighted average of $66,620, a difference of 37.3%.
Householder Income Over 65 years Correlation Summary
| Measurement | Immigrants from Caribbean | Immigrants from Scotland |
| Minimum | $20,075 | $28,672 |
| Maximum | $74,155 | $139,643 |
| Range | $54,080 | $110,971 |
| Mean | $44,830 | $69,451 |
| Median | $44,697 | $68,138 |
| Interquartile 25% (IQ1) | $37,748 | $58,075 |
| Interquartile 75% (IQ3) | $52,750 | $79,459 |
| Interquartile Range (IQR) | $15,003 | $21,384 |
| Standard Deviation (Sample) | $10,716 | $19,829 |
| Standard Deviation (Population) | $10,678 | $19,657 |
Similar Demographics by Householder Income Over 65 years
Demographics Similar to Immigrants from Caribbean by Householder Income Over 65 years
In terms of householder income over 65 years, the demographic groups most similar to Immigrants from Caribbean are Tohono O'odham ($49,121, a difference of 1.2%), Cuban ($49,152, a difference of 1.3%), Crow ($49,234, a difference of 1.4%), Navajo ($47,722, a difference of 1.7%), and Immigrants from Yemen ($47,527, a difference of 2.1%).
| Demographics | Rating | Rank | Householder Income Over 65 years |
| Pima | 0.0 /100 | #331 | Tragic $50,539 |
| Dutch West Indians | 0.0 /100 | #332 | Tragic $50,475 |
| Cape Verdeans | 0.0 /100 | #333 | Tragic $50,077 |
| Immigrants | Dominica | 0.0 /100 | #334 | Tragic $50,071 |
| Crow | 0.0 /100 | #335 | Tragic $49,234 |
| Cubans | 0.0 /100 | #336 | Tragic $49,152 |
| Tohono O'odham | 0.0 /100 | #337 | Tragic $49,121 |
| Immigrants | Caribbean | 0.0 /100 | #338 | Tragic $48,535 |
| Navajo | 0.0 /100 | #339 | Tragic $47,722 |
| Immigrants | Yemen | 0.0 /100 | #340 | Tragic $47,527 |
| Dominicans | 0.0 /100 | #341 | Tragic $46,964 |
| Immigrants | Cabo Verde | 0.0 /100 | #342 | Tragic $46,654 |
| Immigrants | Dominican Republic | 0.0 /100 | #343 | Tragic $45,758 |
| Houma | 0.0 /100 | #344 | Tragic $44,822 |
| Immigrants | Cuba | 0.0 /100 | #345 | Tragic $44,735 |
Demographics Similar to Immigrants from Scotland by Householder Income Over 65 years
In terms of householder income over 65 years, the demographic groups most similar to Immigrants from Scotland are Immigrants from Pakistan ($66,617, a difference of 0.0%), Israeli ($66,636, a difference of 0.020%), Immigrants from Turkey ($66,672, a difference of 0.080%), Immigrants from Indonesia ($66,694, a difference of 0.11%), and Immigrants from Netherlands ($66,463, a difference of 0.24%).
| Demographics | Rating | Rank | Householder Income Over 65 years |
| Immigrants | Afghanistan | 99.8 /100 | #45 | Exceptional $67,007 |
| Cambodians | 99.8 /100 | #46 | Exceptional $66,892 |
| Australians | 99.8 /100 | #47 | Exceptional $66,891 |
| Immigrants | France | 99.8 /100 | #48 | Exceptional $66,826 |
| Immigrants | Indonesia | 99.8 /100 | #49 | Exceptional $66,694 |
| Immigrants | Turkey | 99.7 /100 | #50 | Exceptional $66,672 |
| Israelis | 99.7 /100 | #51 | Exceptional $66,636 |
| Immigrants | Scotland | 99.7 /100 | #52 | Exceptional $66,620 |
| Immigrants | Pakistan | 99.7 /100 | #53 | Exceptional $66,617 |
| Immigrants | Netherlands | 99.7 /100 | #54 | Exceptional $66,463 |
| Immigrants | Czechoslovakia | 99.7 /100 | #55 | Exceptional $66,376 |
| Laotians | 99.6 /100 | #56 | Exceptional $66,306 |
| Bulgarians | 99.6 /100 | #57 | Exceptional $66,236 |
| Immigrants | Philippines | 99.6 /100 | #58 | Exceptional $66,161 |
| Immigrants | Norway | 99.5 /100 | #59 | Exceptional $66,118 |