Immigrants from Caribbean vs Pueblo Householder Income Ages 45 - 64 years
COMPARE
Immigrants from Caribbean
Pueblo
Householder Income Ages 45 - 64 years
Householder Income Ages 45 - 64 years Comparison
Immigrants from Caribbean
Pueblo
$82,513
HOUSEHOLDER INCOME AGES 45 - 64 YEARS
0.0/ 100
METRIC RATING
316th/ 347
METRIC RANK
$75,601
HOUSEHOLDER INCOME AGES 45 - 64 YEARS
0.0/ 100
METRIC RATING
337th/ 347
METRIC RANK
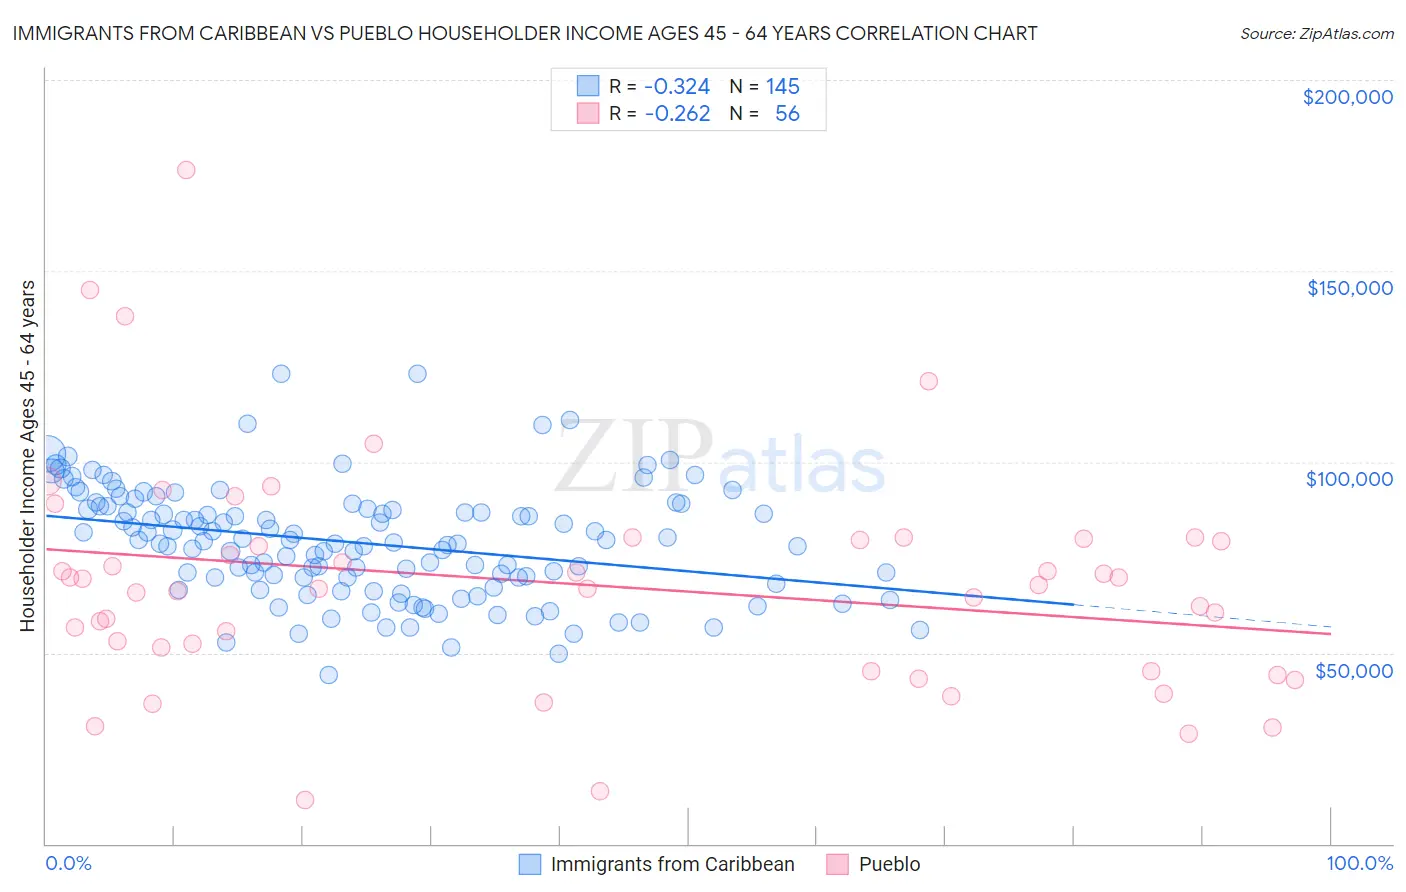
Immigrants from Caribbean vs Pueblo Householder Income Ages 45 - 64 years Correlation Chart
The statistical analysis conducted on geographies consisting of 448,858,846 people shows a mild negative correlation between the proportion of Immigrants from Caribbean and household income with householder between the ages 45 and 64 in the United States with a correlation coefficient (R) of -0.324 and weighted average of $82,513. Similarly, the statistical analysis conducted on geographies consisting of 119,997,423 people shows a weak negative correlation between the proportion of Pueblo and household income with householder between the ages 45 and 64 in the United States with a correlation coefficient (R) of -0.262 and weighted average of $75,601, a difference of 9.1%.
Householder Income Ages 45 - 64 years Correlation Summary
| Measurement | Immigrants from Caribbean | Pueblo |
| Minimum | $44,090 | $11,375 |
| Maximum | $123,114 | $176,310 |
| Range | $79,024 | $164,935 |
| Mean | $78,796 | $68,113 |
| Median | $78,921 | $67,241 |
| Interquartile 25% (IQ1) | $68,886 | $48,248 |
| Interquartile 75% (IQ3) | $87,999 | $79,754 |
| Interquartile Range (IQR) | $19,113 | $31,506 |
| Standard Deviation (Sample) | $14,588 | $29,894 |
| Standard Deviation (Population) | $14,538 | $29,626 |
Similar Demographics by Householder Income Ages 45 - 64 years
Demographics Similar to Immigrants from Caribbean by Householder Income Ages 45 - 64 years
In terms of householder income ages 45 - 64 years, the demographic groups most similar to Immigrants from Caribbean are Colville ($82,474, a difference of 0.050%), Paiute ($82,629, a difference of 0.14%), Immigrants from Honduras ($82,697, a difference of 0.22%), U.S. Virgin Islander ($82,736, a difference of 0.27%), and Choctaw ($82,287, a difference of 0.28%).
| Demographics | Rating | Rank | Householder Income Ages 45 - 64 years |
| Immigrants | Dominica | 0.0 /100 | #309 | Tragic $83,311 |
| Immigrants | Haiti | 0.0 /100 | #310 | Tragic $83,257 |
| Immigrants | Bahamas | 0.0 /100 | #311 | Tragic $83,177 |
| Cajuns | 0.0 /100 | #312 | Tragic $83,015 |
| U.S. Virgin Islanders | 0.0 /100 | #313 | Tragic $82,736 |
| Immigrants | Honduras | 0.0 /100 | #314 | Tragic $82,697 |
| Paiute | 0.0 /100 | #315 | Tragic $82,629 |
| Immigrants | Caribbean | 0.0 /100 | #316 | Tragic $82,513 |
| Colville | 0.0 /100 | #317 | Tragic $82,474 |
| Choctaw | 0.0 /100 | #318 | Tragic $82,287 |
| Chickasaw | 0.0 /100 | #319 | Tragic $82,193 |
| Apache | 0.0 /100 | #320 | Tragic $82,184 |
| Yuman | 0.0 /100 | #321 | Tragic $82,139 |
| Sioux | 0.0 /100 | #322 | Tragic $81,750 |
| Bahamians | 0.0 /100 | #323 | Tragic $81,369 |
Demographics Similar to Pueblo by Householder Income Ages 45 - 64 years
In terms of householder income ages 45 - 64 years, the demographic groups most similar to Pueblo are Hopi ($75,562, a difference of 0.050%), Arapaho ($75,945, a difference of 0.45%), Cheyenne ($76,362, a difference of 1.0%), Kiowa ($74,815, a difference of 1.1%), and Immigrants from Yemen ($74,575, a difference of 1.4%).
| Demographics | Rating | Rank | Householder Income Ages 45 - 64 years |
| Creek | 0.0 /100 | #330 | Tragic $78,960 |
| Immigrants | Dominican Republic | 0.0 /100 | #331 | Tragic $78,836 |
| Blacks/African Americans | 0.0 /100 | #332 | Tragic $78,556 |
| Immigrants | Congo | 0.0 /100 | #333 | Tragic $77,850 |
| Menominee | 0.0 /100 | #334 | Tragic $76,903 |
| Cheyenne | 0.0 /100 | #335 | Tragic $76,362 |
| Arapaho | 0.0 /100 | #336 | Tragic $75,945 |
| Pueblo | 0.0 /100 | #337 | Tragic $75,601 |
| Hopi | 0.0 /100 | #338 | Tragic $75,562 |
| Kiowa | 0.0 /100 | #339 | Tragic $74,815 |
| Immigrants | Yemen | 0.0 /100 | #340 | Tragic $74,575 |
| Crow | 0.0 /100 | #341 | Tragic $74,257 |
| Tohono O'odham | 0.0 /100 | #342 | Tragic $73,774 |
| Pima | 0.0 /100 | #343 | Tragic $73,365 |
| Houma | 0.0 /100 | #344 | Tragic $72,093 |