Immigrants from Caribbean vs Immigrants from Kuwait Householder Income Ages 45 - 64 years
COMPARE
Immigrants from Caribbean
Immigrants from Kuwait
Householder Income Ages 45 - 64 years
Householder Income Ages 45 - 64 years Comparison
Immigrants from Caribbean
Immigrants from Kuwait
$82,513
HOUSEHOLDER INCOME AGES 45 - 64 YEARS
0.0/ 100
METRIC RATING
316th/ 347
METRIC RANK
$106,285
HOUSEHOLDER INCOME AGES 45 - 64 YEARS
95.2/ 100
METRIC RATING
115th/ 347
METRIC RANK
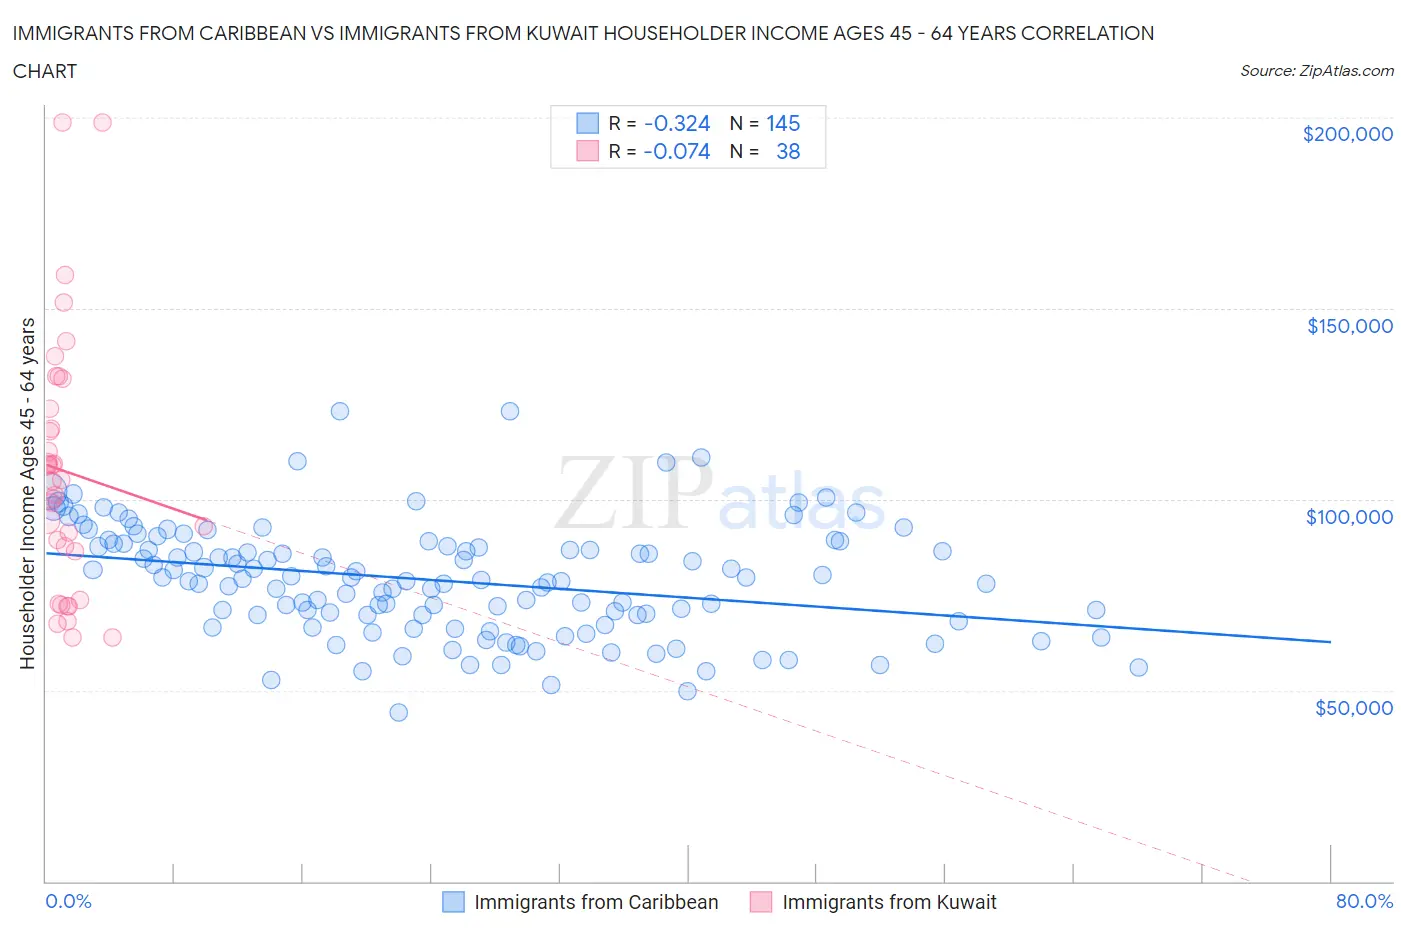
Immigrants from Caribbean vs Immigrants from Kuwait Householder Income Ages 45 - 64 years Correlation Chart
The statistical analysis conducted on geographies consisting of 448,858,846 people shows a mild negative correlation between the proportion of Immigrants from Caribbean and household income with householder between the ages 45 and 64 in the United States with a correlation coefficient (R) of -0.324 and weighted average of $82,513. Similarly, the statistical analysis conducted on geographies consisting of 136,856,886 people shows a slight negative correlation between the proportion of Immigrants from Kuwait and household income with householder between the ages 45 and 64 in the United States with a correlation coefficient (R) of -0.074 and weighted average of $106,285, a difference of 28.8%.
Householder Income Ages 45 - 64 years Correlation Summary
| Measurement | Immigrants from Caribbean | Immigrants from Kuwait |
| Minimum | $44,090 | $63,767 |
| Maximum | $123,114 | $198,648 |
| Range | $79,024 | $134,881 |
| Mean | $78,796 | $107,348 |
| Median | $78,921 | $104,899 |
| Interquartile 25% (IQ1) | $68,886 | $86,528 |
| Interquartile 75% (IQ3) | $87,999 | $123,748 |
| Interquartile Range (IQR) | $19,113 | $37,220 |
| Standard Deviation (Sample) | $14,588 | $33,135 |
| Standard Deviation (Population) | $14,538 | $32,696 |
Similar Demographics by Householder Income Ages 45 - 64 years
Demographics Similar to Immigrants from Caribbean by Householder Income Ages 45 - 64 years
In terms of householder income ages 45 - 64 years, the demographic groups most similar to Immigrants from Caribbean are Colville ($82,474, a difference of 0.050%), Paiute ($82,629, a difference of 0.14%), Immigrants from Honduras ($82,697, a difference of 0.22%), U.S. Virgin Islander ($82,736, a difference of 0.27%), and Choctaw ($82,287, a difference of 0.28%).
| Demographics | Rating | Rank | Householder Income Ages 45 - 64 years |
| Immigrants | Dominica | 0.0 /100 | #309 | Tragic $83,311 |
| Immigrants | Haiti | 0.0 /100 | #310 | Tragic $83,257 |
| Immigrants | Bahamas | 0.0 /100 | #311 | Tragic $83,177 |
| Cajuns | 0.0 /100 | #312 | Tragic $83,015 |
| U.S. Virgin Islanders | 0.0 /100 | #313 | Tragic $82,736 |
| Immigrants | Honduras | 0.0 /100 | #314 | Tragic $82,697 |
| Paiute | 0.0 /100 | #315 | Tragic $82,629 |
| Immigrants | Caribbean | 0.0 /100 | #316 | Tragic $82,513 |
| Colville | 0.0 /100 | #317 | Tragic $82,474 |
| Choctaw | 0.0 /100 | #318 | Tragic $82,287 |
| Chickasaw | 0.0 /100 | #319 | Tragic $82,193 |
| Apache | 0.0 /100 | #320 | Tragic $82,184 |
| Yuman | 0.0 /100 | #321 | Tragic $82,139 |
| Sioux | 0.0 /100 | #322 | Tragic $81,750 |
| Bahamians | 0.0 /100 | #323 | Tragic $81,369 |
Demographics Similar to Immigrants from Kuwait by Householder Income Ages 45 - 64 years
In terms of householder income ages 45 - 64 years, the demographic groups most similar to Immigrants from Kuwait are British ($106,264, a difference of 0.020%), Immigrants from Poland ($106,319, a difference of 0.030%), Albanian ($106,243, a difference of 0.040%), Immigrants from Western Asia ($106,217, a difference of 0.060%), and European ($106,367, a difference of 0.080%).
| Demographics | Rating | Rank | Householder Income Ages 45 - 64 years |
| Zimbabweans | 96.3 /100 | #108 | Exceptional $106,849 |
| Chileans | 95.9 /100 | #109 | Exceptional $106,611 |
| Immigrants | Brazil | 95.6 /100 | #110 | Exceptional $106,470 |
| Immigrants | Vietnam | 95.5 /100 | #111 | Exceptional $106,417 |
| Swedes | 95.4 /100 | #112 | Exceptional $106,377 |
| Europeans | 95.4 /100 | #113 | Exceptional $106,367 |
| Immigrants | Poland | 95.3 /100 | #114 | Exceptional $106,319 |
| Immigrants | Kuwait | 95.2 /100 | #115 | Exceptional $106,285 |
| British | 95.2 /100 | #116 | Exceptional $106,264 |
| Albanians | 95.1 /100 | #117 | Exceptional $106,243 |
| Immigrants | Western Asia | 95.0 /100 | #118 | Exceptional $106,217 |
| Immigrants | Jordan | 94.9 /100 | #119 | Exceptional $106,164 |
| Immigrants | South Eastern Asia | 94.8 /100 | #120 | Exceptional $106,109 |
| Poles | 94.4 /100 | #121 | Exceptional $105,952 |
| Immigrants | North Macedonia | 94.2 /100 | #122 | Exceptional $105,892 |