Immigrants from South Africa vs Immigrants from Central America Median Earnings
COMPARE
Immigrants from South Africa
Immigrants from Central America
Median Earnings
Median Earnings Comparison
Immigrants from South Africa
Immigrants from Central America
$51,850
MEDIAN EARNINGS
100.0/ 100
METRIC RATING
50th/ 347
METRIC RANK
$39,762
MEDIAN EARNINGS
0.0/ 100
METRIC RATING
322nd/ 347
METRIC RANK
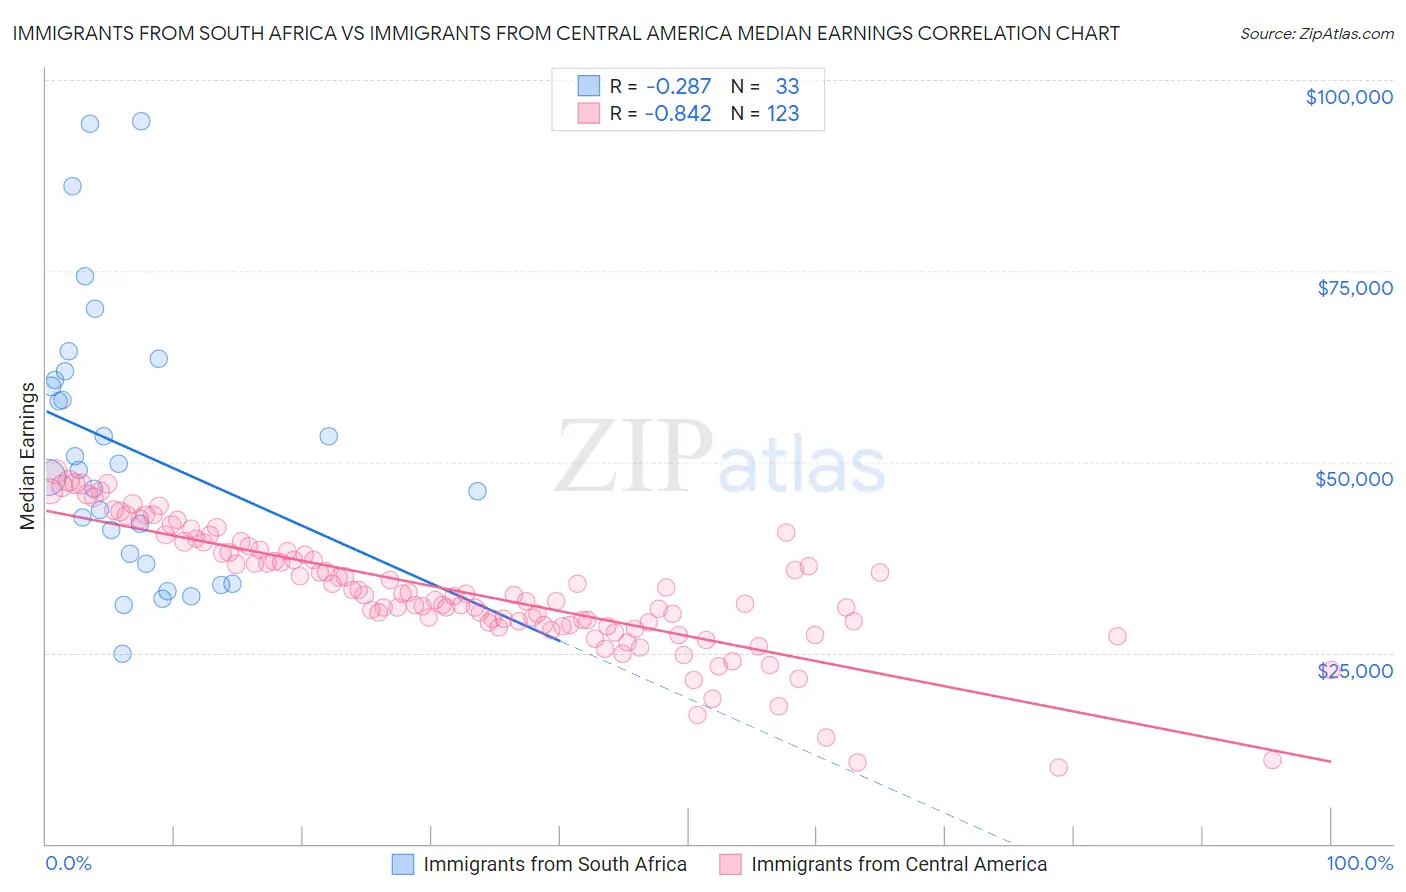
Immigrants from South Africa vs Immigrants from Central America Median Earnings Correlation Chart
The statistical analysis conducted on geographies consisting of 233,296,995 people shows a weak negative correlation between the proportion of Immigrants from South Africa and median earnings in the United States with a correlation coefficient (R) of -0.287 and weighted average of $51,850. Similarly, the statistical analysis conducted on geographies consisting of 536,322,180 people shows a very strong negative correlation between the proportion of Immigrants from Central America and median earnings in the United States with a correlation coefficient (R) of -0.842 and weighted average of $39,762, a difference of 30.4%.
Median Earnings Correlation Summary
| Measurement | Immigrants from South Africa | Immigrants from Central America |
| Minimum | $24,853 | $9,917 |
| Maximum | $94,663 | $48,696 |
| Range | $69,810 | $38,779 |
| Mean | $51,765 | $33,043 |
| Median | $48,953 | $32,380 |
| Interquartile 25% (IQ1) | $37,328 | $28,620 |
| Interquartile 75% (IQ3) | $61,361 | $38,496 |
| Interquartile Range (IQR) | $24,033 | $9,875 |
| Standard Deviation (Sample) | $17,731 | $8,045 |
| Standard Deviation (Population) | $17,460 | $8,012 |
Similar Demographics by Median Earnings
Demographics Similar to Immigrants from South Africa by Median Earnings
In terms of median earnings, the demographic groups most similar to Immigrants from South Africa are Immigrants from Austria ($51,826, a difference of 0.050%), Estonian ($51,772, a difference of 0.15%), Immigrants from Norway ($51,758, a difference of 0.18%), Immigrants from Indonesia ($51,715, a difference of 0.26%), and Egyptian ($51,701, a difference of 0.29%).
| Demographics | Rating | Rank | Median Earnings |
| Immigrants | Malaysia | 100.0 /100 | #43 | Exceptional $52,514 |
| Bulgarians | 100.0 /100 | #44 | Exceptional $52,512 |
| Immigrants | Czechoslovakia | 100.0 /100 | #45 | Exceptional $52,361 |
| Bhutanese | 100.0 /100 | #46 | Exceptional $52,297 |
| Australians | 100.0 /100 | #47 | Exceptional $52,294 |
| Immigrants | Europe | 100.0 /100 | #48 | Exceptional $52,195 |
| Bolivians | 100.0 /100 | #49 | Exceptional $52,005 |
| Immigrants | South Africa | 100.0 /100 | #50 | Exceptional $51,850 |
| Immigrants | Austria | 99.9 /100 | #51 | Exceptional $51,826 |
| Estonians | 99.9 /100 | #52 | Exceptional $51,772 |
| Immigrants | Norway | 99.9 /100 | #53 | Exceptional $51,758 |
| Immigrants | Indonesia | 99.9 /100 | #54 | Exceptional $51,715 |
| Egyptians | 99.9 /100 | #55 | Exceptional $51,701 |
| Immigrants | Pakistan | 99.9 /100 | #56 | Exceptional $51,693 |
| Immigrants | Eastern Europe | 99.9 /100 | #57 | Exceptional $51,624 |
Demographics Similar to Immigrants from Central America by Median Earnings
In terms of median earnings, the demographic groups most similar to Immigrants from Central America are Bahamian ($39,735, a difference of 0.070%), Ottawa ($39,721, a difference of 0.10%), Mexican ($39,834, a difference of 0.18%), Immigrants from Bahamas ($39,861, a difference of 0.25%), and Creek ($39,648, a difference of 0.29%).
| Demographics | Rating | Rank | Median Earnings |
| Seminole | 0.0 /100 | #315 | Tragic $40,233 |
| Immigrants | Honduras | 0.0 /100 | #316 | Tragic $40,195 |
| Fijians | 0.0 /100 | #317 | Tragic $40,193 |
| Dutch West Indians | 0.0 /100 | #318 | Tragic $40,107 |
| Blacks/African Americans | 0.0 /100 | #319 | Tragic $40,085 |
| Immigrants | Bahamas | 0.0 /100 | #320 | Tragic $39,861 |
| Mexicans | 0.0 /100 | #321 | Tragic $39,834 |
| Immigrants | Central America | 0.0 /100 | #322 | Tragic $39,762 |
| Bahamians | 0.0 /100 | #323 | Tragic $39,735 |
| Ottawa | 0.0 /100 | #324 | Tragic $39,721 |
| Creek | 0.0 /100 | #325 | Tragic $39,648 |
| Immigrants | Yemen | 0.0 /100 | #326 | Tragic $39,540 |
| Yuman | 0.0 /100 | #327 | Tragic $39,523 |
| Sioux | 0.0 /100 | #328 | Tragic $39,448 |
| Kiowa | 0.0 /100 | #329 | Tragic $39,232 |