Ute vs Immigrants from Central America Median Earnings
COMPARE
Ute
Immigrants from Central America
Median Earnings
Median Earnings Comparison
Ute
Immigrants from Central America
$41,051
MEDIAN EARNINGS
0.1/ 100
METRIC RATING
300th/ 347
METRIC RANK
$39,762
MEDIAN EARNINGS
0.0/ 100
METRIC RATING
322nd/ 347
METRIC RANK
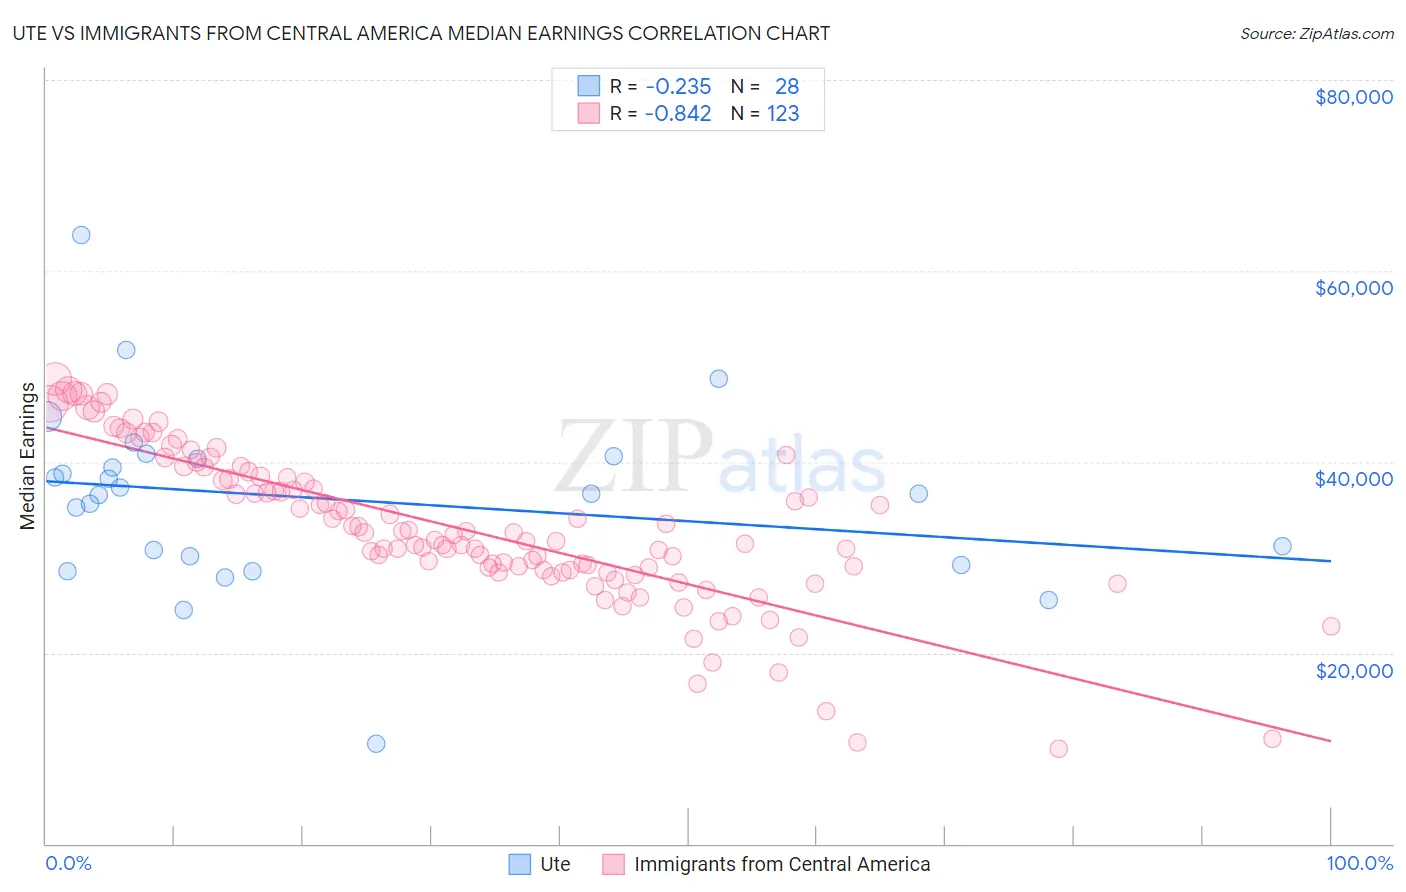
Ute vs Immigrants from Central America Median Earnings Correlation Chart
The statistical analysis conducted on geographies consisting of 55,664,253 people shows a weak negative correlation between the proportion of Ute and median earnings in the United States with a correlation coefficient (R) of -0.235 and weighted average of $41,051. Similarly, the statistical analysis conducted on geographies consisting of 536,322,180 people shows a very strong negative correlation between the proportion of Immigrants from Central America and median earnings in the United States with a correlation coefficient (R) of -0.842 and weighted average of $39,762, a difference of 3.2%.
Median Earnings Correlation Summary
| Measurement | Ute | Immigrants from Central America |
| Minimum | $10,500 | $9,917 |
| Maximum | $63,719 | $48,696 |
| Range | $53,219 | $38,779 |
| Mean | $36,165 | $33,043 |
| Median | $36,686 | $32,380 |
| Interquartile 25% (IQ1) | $29,690 | $28,620 |
| Interquartile 75% (IQ3) | $40,497 | $38,496 |
| Interquartile Range (IQR) | $10,807 | $9,875 |
| Standard Deviation (Sample) | $9,794 | $8,045 |
| Standard Deviation (Population) | $9,618 | $8,012 |
Similar Demographics by Median Earnings
Demographics Similar to Ute by Median Earnings
In terms of median earnings, the demographic groups most similar to Ute are Immigrants from Latin America ($41,049, a difference of 0.010%), Immigrants from Caribbean ($41,119, a difference of 0.17%), Immigrants from Micronesia ($41,133, a difference of 0.20%), Shoshone ($40,932, a difference of 0.29%), and Haitian ($40,918, a difference of 0.32%).
| Demographics | Rating | Rank | Median Earnings |
| Immigrants | Zaire | 0.1 /100 | #293 | Tragic $41,325 |
| Potawatomi | 0.1 /100 | #294 | Tragic $41,288 |
| Bangladeshis | 0.1 /100 | #295 | Tragic $41,263 |
| Cherokee | 0.1 /100 | #296 | Tragic $41,252 |
| Guatemalans | 0.1 /100 | #297 | Tragic $41,205 |
| Immigrants | Micronesia | 0.1 /100 | #298 | Tragic $41,133 |
| Immigrants | Caribbean | 0.1 /100 | #299 | Tragic $41,119 |
| Ute | 0.1 /100 | #300 | Tragic $41,051 |
| Immigrants | Latin America | 0.1 /100 | #301 | Tragic $41,049 |
| Shoshone | 0.0 /100 | #302 | Tragic $40,932 |
| Haitians | 0.0 /100 | #303 | Tragic $40,918 |
| Immigrants | Guatemala | 0.0 /100 | #304 | Tragic $40,851 |
| Chickasaw | 0.0 /100 | #305 | Tragic $40,672 |
| Yaqui | 0.0 /100 | #306 | Tragic $40,647 |
| Hondurans | 0.0 /100 | #307 | Tragic $40,638 |
Demographics Similar to Immigrants from Central America by Median Earnings
In terms of median earnings, the demographic groups most similar to Immigrants from Central America are Bahamian ($39,735, a difference of 0.070%), Ottawa ($39,721, a difference of 0.10%), Mexican ($39,834, a difference of 0.18%), Immigrants from Bahamas ($39,861, a difference of 0.25%), and Creek ($39,648, a difference of 0.29%).
| Demographics | Rating | Rank | Median Earnings |
| Seminole | 0.0 /100 | #315 | Tragic $40,233 |
| Immigrants | Honduras | 0.0 /100 | #316 | Tragic $40,195 |
| Fijians | 0.0 /100 | #317 | Tragic $40,193 |
| Dutch West Indians | 0.0 /100 | #318 | Tragic $40,107 |
| Blacks/African Americans | 0.0 /100 | #319 | Tragic $40,085 |
| Immigrants | Bahamas | 0.0 /100 | #320 | Tragic $39,861 |
| Mexicans | 0.0 /100 | #321 | Tragic $39,834 |
| Immigrants | Central America | 0.0 /100 | #322 | Tragic $39,762 |
| Bahamians | 0.0 /100 | #323 | Tragic $39,735 |
| Ottawa | 0.0 /100 | #324 | Tragic $39,721 |
| Creek | 0.0 /100 | #325 | Tragic $39,648 |
| Immigrants | Yemen | 0.0 /100 | #326 | Tragic $39,540 |
| Yuman | 0.0 /100 | #327 | Tragic $39,523 |
| Sioux | 0.0 /100 | #328 | Tragic $39,448 |
| Kiowa | 0.0 /100 | #329 | Tragic $39,232 |