Immigrants from Caribbean vs Cajun Female Poverty Among 18-24 Year Olds
COMPARE
Immigrants from Caribbean
Cajun
Female Poverty Among 18-24 Year Olds
Female Poverty Among 18-24 Year Olds Comparison
Immigrants from Caribbean
Cajuns
19.1%
FEMALE POVERTY AMONG 18-24 YEAR OLDS
98.1/ 100
METRIC RATING
102nd/ 347
METRIC RANK
25.7%
FEMALE POVERTY AMONG 18-24 YEAR OLDS
0.0/ 100
METRIC RATING
329th/ 347
METRIC RANK
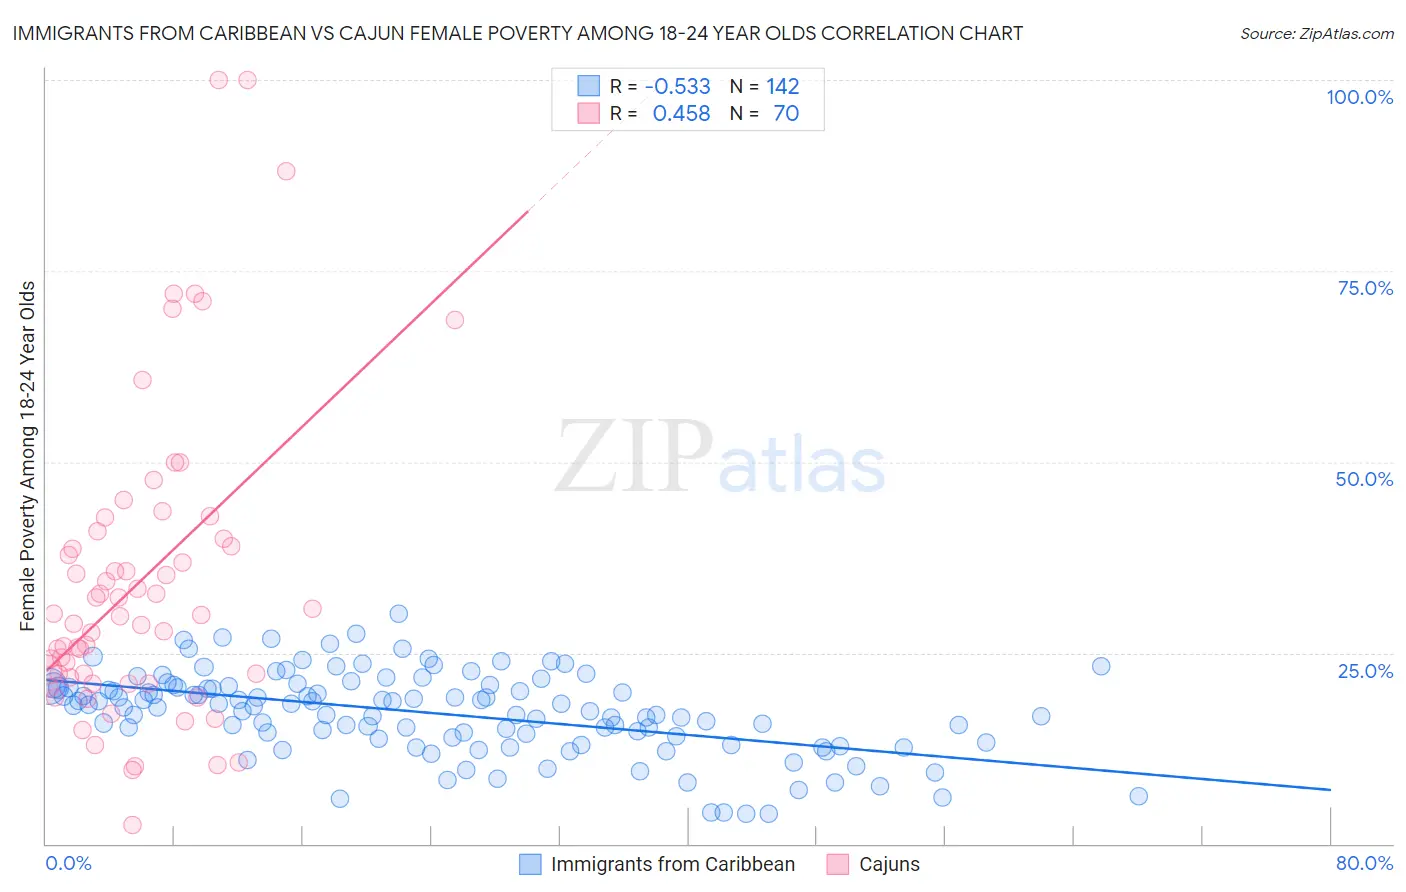
Immigrants from Caribbean vs Cajun Female Poverty Among 18-24 Year Olds Correlation Chart
The statistical analysis conducted on geographies consisting of 436,067,401 people shows a substantial negative correlation between the proportion of Immigrants from Caribbean and poverty level among females between the ages 18 and 24 in the United States with a correlation coefficient (R) of -0.533 and weighted average of 19.1%. Similarly, the statistical analysis conducted on geographies consisting of 148,140,723 people shows a moderate positive correlation between the proportion of Cajuns and poverty level among females between the ages 18 and 24 in the United States with a correlation coefficient (R) of 0.458 and weighted average of 25.7%, a difference of 34.3%.
Female Poverty Among 18-24 Year Olds Correlation Summary
| Measurement | Immigrants from Caribbean | Cajun |
| Minimum | 4.0% | 2.4% |
| Maximum | 30.2% | 100.0% |
| Range | 26.2% | 97.6% |
| Mean | 17.1% | 34.3% |
| Median | 18.0% | 29.9% |
| Interquartile 25% (IQ1) | 13.9% | 21.7% |
| Interquartile 75% (IQ3) | 20.6% | 40.0% |
| Interquartile Range (IQR) | 6.7% | 18.3% |
| Standard Deviation (Sample) | 5.4% | 20.2% |
| Standard Deviation (Population) | 5.4% | 20.1% |
Similar Demographics by Female Poverty Among 18-24 Year Olds
Demographics Similar to Immigrants from Caribbean by Female Poverty Among 18-24 Year Olds
In terms of female poverty among 18-24 year olds, the demographic groups most similar to Immigrants from Caribbean are Ecuadorian (19.1%, a difference of 0.020%), Serbian (19.1%, a difference of 0.040%), Immigrants from Afghanistan (19.1%, a difference of 0.080%), Chilean (19.1%, a difference of 0.11%), and Immigrants from Czechoslovakia (19.1%, a difference of 0.13%).
| Demographics | Rating | Rank | Female Poverty Among 18-24 Year Olds |
| Guamanians/Chamorros | 98.8 /100 | #95 | Exceptional 19.0% |
| Sierra Leoneans | 98.7 /100 | #96 | Exceptional 19.0% |
| Salvadorans | 98.4 /100 | #97 | Exceptional 19.1% |
| Immigrants | Jordan | 98.4 /100 | #98 | Exceptional 19.1% |
| Immigrants | Czechoslovakia | 98.3 /100 | #99 | Exceptional 19.1% |
| Chileans | 98.3 /100 | #100 | Exceptional 19.1% |
| Ecuadorians | 98.1 /100 | #101 | Exceptional 19.1% |
| Immigrants | Caribbean | 98.1 /100 | #102 | Exceptional 19.1% |
| Serbians | 98.0 /100 | #103 | Exceptional 19.1% |
| Immigrants | Afghanistan | 98.0 /100 | #104 | Exceptional 19.1% |
| Immigrants | Ecuador | 97.8 /100 | #105 | Exceptional 19.2% |
| Immigrants | Sierra Leone | 97.8 /100 | #106 | Exceptional 19.2% |
| Immigrants | Sri Lanka | 97.5 /100 | #107 | Exceptional 19.2% |
| Immigrants | Uzbekistan | 97.3 /100 | #108 | Exceptional 19.2% |
| Immigrants | Syria | 97.2 /100 | #109 | Exceptional 19.2% |
Demographics Similar to Cajuns by Female Poverty Among 18-24 Year Olds
In terms of female poverty among 18-24 year olds, the demographic groups most similar to Cajuns are Immigrants from Somalia (25.7%, a difference of 0.21%), Chippewa (25.9%, a difference of 0.86%), Native/Alaskan (25.4%, a difference of 1.1%), Ute (25.4%, a difference of 1.1%), and Yakama (25.3%, a difference of 1.4%).
| Demographics | Rating | Rank | Female Poverty Among 18-24 Year Olds |
| Somalis | 0.0 /100 | #322 | Tragic 25.1% |
| Arapaho | 0.0 /100 | #323 | Tragic 25.2% |
| German Russians | 0.0 /100 | #324 | Tragic 25.2% |
| Immigrants | Saudi Arabia | 0.0 /100 | #325 | Tragic 25.3% |
| Yakama | 0.0 /100 | #326 | Tragic 25.3% |
| Ute | 0.0 /100 | #327 | Tragic 25.4% |
| Natives/Alaskans | 0.0 /100 | #328 | Tragic 25.4% |
| Cajuns | 0.0 /100 | #329 | Tragic 25.7% |
| Immigrants | Somalia | 0.0 /100 | #330 | Tragic 25.7% |
| Chippewa | 0.0 /100 | #331 | Tragic 25.9% |
| Houma | 0.0 /100 | #332 | Tragic 26.2% |
| Apache | 0.0 /100 | #333 | Tragic 26.3% |
| Pueblo | 0.0 /100 | #334 | Tragic 26.9% |
| Yup'ik | 0.0 /100 | #335 | Tragic 27.0% |
| Immigrants | Yemen | 0.0 /100 | #336 | Tragic 27.5% |