Immigrants from Canada vs French Median Female Earnings
COMPARE
Immigrants from Canada
French
Median Female Earnings
Median Female Earnings Comparison
Immigrants from Canada
French
$41,373
MEDIAN FEMALE EARNINGS
97.0/ 100
METRIC RATING
111th/ 347
METRIC RANK
$38,457
MEDIAN FEMALE EARNINGS
7.0/ 100
METRIC RATING
225th/ 347
METRIC RANK
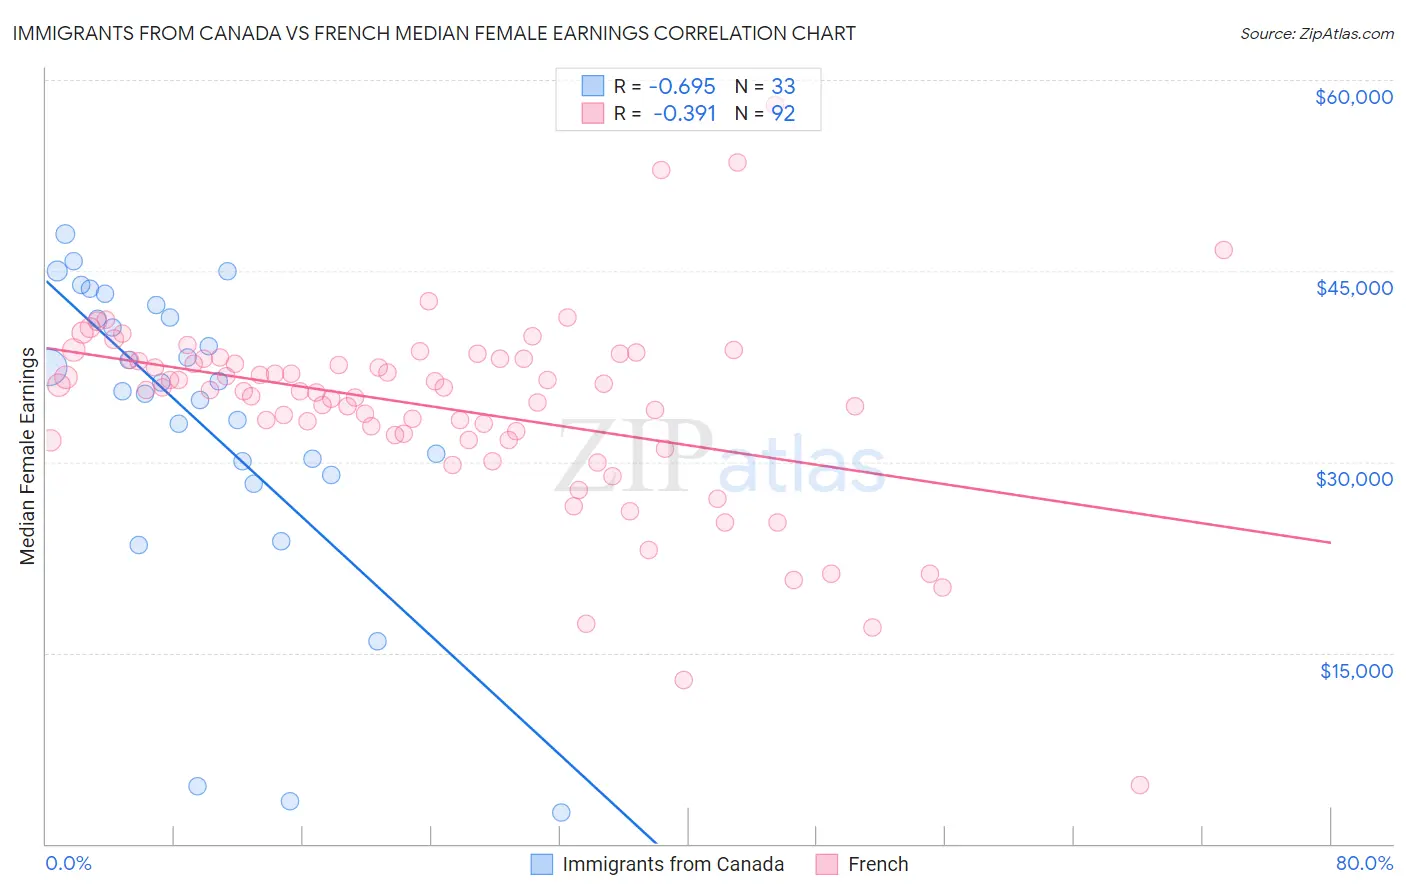
Immigrants from Canada vs French Median Female Earnings Correlation Chart
The statistical analysis conducted on geographies consisting of 459,023,648 people shows a significant negative correlation between the proportion of Immigrants from Canada and median female earnings in the United States with a correlation coefficient (R) of -0.695 and weighted average of $41,373. Similarly, the statistical analysis conducted on geographies consisting of 570,640,239 people shows a mild negative correlation between the proportion of French and median female earnings in the United States with a correlation coefficient (R) of -0.391 and weighted average of $38,457, a difference of 7.6%.
Median Female Earnings Correlation Summary
| Measurement | Immigrants from Canada | French |
| Minimum | $2,499 | $4,625 |
| Maximum | $47,885 | $58,008 |
| Range | $45,386 | $53,383 |
| Mean | $33,293 | $34,289 |
| Median | $36,283 | $35,683 |
| Interquartile 25% (IQ1) | $29,495 | $31,891 |
| Interquartile 75% (IQ3) | $41,844 | $38,063 |
| Interquartile Range (IQR) | $12,349 | $6,171 |
| Standard Deviation (Sample) | $11,971 | $7,750 |
| Standard Deviation (Population) | $11,788 | $7,708 |
Similar Demographics by Median Female Earnings
Demographics Similar to Immigrants from Canada by Median Female Earnings
In terms of median female earnings, the demographic groups most similar to Immigrants from Canada are Immigrants from Western Asia ($41,375, a difference of 0.010%), Immigrants from North America ($41,319, a difference of 0.13%), Chinese ($41,461, a difference of 0.21%), Macedonian ($41,286, a difference of 0.21%), and Jordanian ($41,464, a difference of 0.22%).
| Demographics | Rating | Rank | Median Female Earnings |
| Immigrants | Zimbabwe | 97.8 /100 | #104 | Exceptional $41,527 |
| Italians | 97.7 /100 | #105 | Exceptional $41,505 |
| Immigrants | Eritrea | 97.6 /100 | #106 | Exceptional $41,485 |
| Palestinians | 97.6 /100 | #107 | Exceptional $41,484 |
| Jordanians | 97.5 /100 | #108 | Exceptional $41,464 |
| Chinese | 97.5 /100 | #109 | Exceptional $41,461 |
| Immigrants | Western Asia | 97.0 /100 | #110 | Exceptional $41,375 |
| Immigrants | Canada | 97.0 /100 | #111 | Exceptional $41,373 |
| Immigrants | North America | 96.7 /100 | #112 | Exceptional $41,319 |
| Macedonians | 96.4 /100 | #113 | Exceptional $41,286 |
| Immigrants | England | 96.4 /100 | #114 | Exceptional $41,277 |
| Koreans | 96.4 /100 | #115 | Exceptional $41,276 |
| Immigrants | Brazil | 96.4 /100 | #116 | Exceptional $41,273 |
| Barbadians | 96.3 /100 | #117 | Exceptional $41,261 |
| Immigrants | Lebanon | 95.6 /100 | #118 | Exceptional $41,183 |
Demographics Similar to French by Median Female Earnings
In terms of median female earnings, the demographic groups most similar to French are Native Hawaiian ($38,461, a difference of 0.010%), French Canadian ($38,436, a difference of 0.050%), Immigrants from Sudan ($38,511, a difference of 0.14%), Scottish ($38,397, a difference of 0.15%), and Subsaharan African ($38,391, a difference of 0.17%).
| Demographics | Rating | Rank | Median Female Earnings |
| Cape Verdeans | 9.5 /100 | #218 | Tragic $38,614 |
| Nepalese | 9.3 /100 | #219 | Tragic $38,603 |
| Yugoslavians | 8.8 /100 | #220 | Tragic $38,573 |
| Immigrants | Azores | 8.8 /100 | #221 | Tragic $38,573 |
| Japanese | 8.1 /100 | #222 | Tragic $38,528 |
| Immigrants | Sudan | 7.8 /100 | #223 | Tragic $38,511 |
| Native Hawaiians | 7.1 /100 | #224 | Tragic $38,461 |
| French | 7.0 /100 | #225 | Tragic $38,457 |
| French Canadians | 6.8 /100 | #226 | Tragic $38,436 |
| Scottish | 6.3 /100 | #227 | Tragic $38,397 |
| Sub-Saharan Africans | 6.2 /100 | #228 | Tragic $38,391 |
| Belgians | 6.1 /100 | #229 | Tragic $38,382 |
| Basques | 5.7 /100 | #230 | Tragic $38,352 |
| Somalis | 5.5 /100 | #231 | Tragic $38,333 |
| Scandinavians | 5.2 /100 | #232 | Tragic $38,306 |