Immigrants from St. Vincent and the Grenadines vs French Median Female Earnings
COMPARE
Immigrants from St. Vincent and the Grenadines
French
Median Female Earnings
Median Female Earnings Comparison
Immigrants from St. Vincent and the Grenadines
French
$42,108
MEDIAN FEMALE EARNINGS
99.3/ 100
METRIC RATING
86th/ 347
METRIC RANK
$38,457
MEDIAN FEMALE EARNINGS
7.0/ 100
METRIC RATING
225th/ 347
METRIC RANK
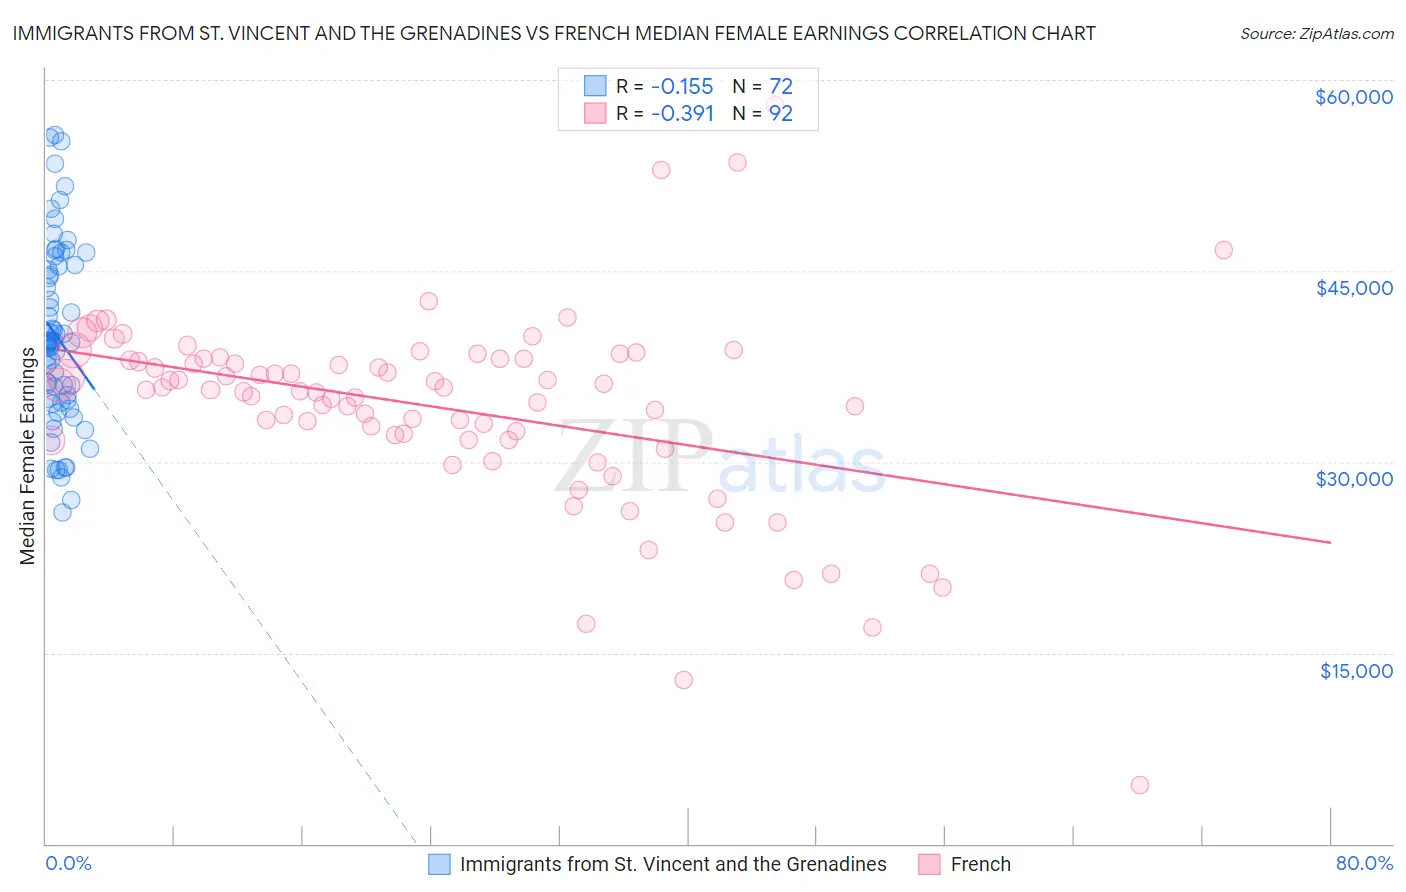
Immigrants from St. Vincent and the Grenadines vs French Median Female Earnings Correlation Chart
The statistical analysis conducted on geographies consisting of 56,186,609 people shows a poor negative correlation between the proportion of Immigrants from St. Vincent and the Grenadines and median female earnings in the United States with a correlation coefficient (R) of -0.155 and weighted average of $42,108. Similarly, the statistical analysis conducted on geographies consisting of 570,640,239 people shows a mild negative correlation between the proportion of French and median female earnings in the United States with a correlation coefficient (R) of -0.391 and weighted average of $38,457, a difference of 9.5%.
Median Female Earnings Correlation Summary
| Measurement | Immigrants from St. Vincent and the Grenadines | French |
| Minimum | $26,069 | $4,625 |
| Maximum | $55,714 | $58,008 |
| Range | $29,645 | $53,383 |
| Mean | $39,753 | $34,289 |
| Median | $39,381 | $35,683 |
| Interquartile 25% (IQ1) | $34,722 | $31,891 |
| Interquartile 75% (IQ3) | $45,227 | $38,063 |
| Interquartile Range (IQR) | $10,505 | $6,171 |
| Standard Deviation (Sample) | $7,078 | $7,750 |
| Standard Deviation (Population) | $7,029 | $7,708 |
Similar Demographics by Median Female Earnings
Demographics Similar to Immigrants from St. Vincent and the Grenadines by Median Female Earnings
In terms of median female earnings, the demographic groups most similar to Immigrants from St. Vincent and the Grenadines are Lithuanian ($42,108, a difference of 0.0%), Laotian ($42,133, a difference of 0.060%), Immigrants from Northern Africa ($42,084, a difference of 0.060%), Immigrants from Afghanistan ($42,055, a difference of 0.13%), and Ukrainian ($42,015, a difference of 0.22%).
| Demographics | Rating | Rank | Median Female Earnings |
| Greeks | 99.6 /100 | #79 | Exceptional $42,336 |
| Immigrants | Moldova | 99.6 /100 | #80 | Exceptional $42,304 |
| Immigrants | Southern Europe | 99.5 /100 | #81 | Exceptional $42,275 |
| Immigrants | Morocco | 99.5 /100 | #82 | Exceptional $42,229 |
| Immigrants | Sierra Leone | 99.5 /100 | #83 | Exceptional $42,214 |
| Armenians | 99.5 /100 | #84 | Exceptional $42,212 |
| Laotians | 99.4 /100 | #85 | Exceptional $42,133 |
| Immigrants | St. Vincent and the Grenadines | 99.3 /100 | #86 | Exceptional $42,108 |
| Lithuanians | 99.3 /100 | #87 | Exceptional $42,108 |
| Immigrants | Northern Africa | 99.3 /100 | #88 | Exceptional $42,084 |
| Immigrants | Afghanistan | 99.3 /100 | #89 | Exceptional $42,055 |
| Ukrainians | 99.2 /100 | #90 | Exceptional $42,015 |
| Immigrants | Western Europe | 99.2 /100 | #91 | Exceptional $41,990 |
| Argentineans | 99.1 /100 | #92 | Exceptional $41,952 |
| Immigrants | Grenada | 99.0 /100 | #93 | Exceptional $41,932 |
Demographics Similar to French by Median Female Earnings
In terms of median female earnings, the demographic groups most similar to French are Native Hawaiian ($38,461, a difference of 0.010%), French Canadian ($38,436, a difference of 0.050%), Immigrants from Sudan ($38,511, a difference of 0.14%), Scottish ($38,397, a difference of 0.15%), and Subsaharan African ($38,391, a difference of 0.17%).
| Demographics | Rating | Rank | Median Female Earnings |
| Cape Verdeans | 9.5 /100 | #218 | Tragic $38,614 |
| Nepalese | 9.3 /100 | #219 | Tragic $38,603 |
| Yugoslavians | 8.8 /100 | #220 | Tragic $38,573 |
| Immigrants | Azores | 8.8 /100 | #221 | Tragic $38,573 |
| Japanese | 8.1 /100 | #222 | Tragic $38,528 |
| Immigrants | Sudan | 7.8 /100 | #223 | Tragic $38,511 |
| Native Hawaiians | 7.1 /100 | #224 | Tragic $38,461 |
| French | 7.0 /100 | #225 | Tragic $38,457 |
| French Canadians | 6.8 /100 | #226 | Tragic $38,436 |
| Scottish | 6.3 /100 | #227 | Tragic $38,397 |
| Sub-Saharan Africans | 6.2 /100 | #228 | Tragic $38,391 |
| Belgians | 6.1 /100 | #229 | Tragic $38,382 |
| Basques | 5.7 /100 | #230 | Tragic $38,352 |
| Somalis | 5.5 /100 | #231 | Tragic $38,333 |
| Scandinavians | 5.2 /100 | #232 | Tragic $38,306 |