Immigrants from Canada vs French Child Poverty Under the Age of 16
COMPARE
Immigrants from Canada
French
Child Poverty Under the Age of 16
Child Poverty Under the Age of 16 Comparison
Immigrants from Canada
French
14.5%
CHILD POVERTY UNDER THE AGE OF 16
97.2/ 100
METRIC RATING
82nd/ 347
METRIC RANK
15.6%
CHILD POVERTY UNDER THE AGE OF 16
78.5/ 100
METRIC RATING
151st/ 347
METRIC RANK
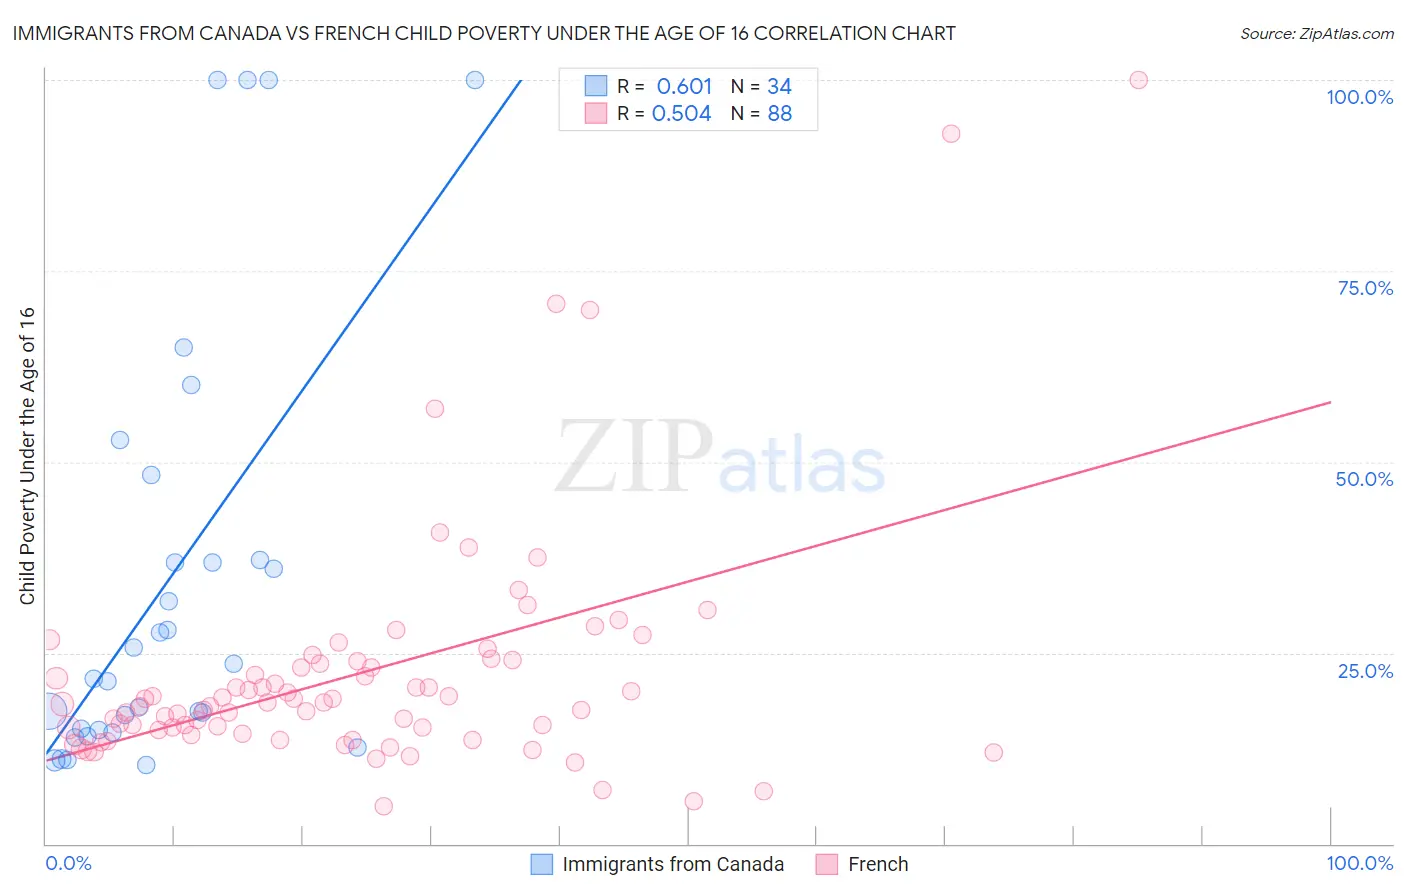
Immigrants from Canada vs French Child Poverty Under the Age of 16 Correlation Chart
The statistical analysis conducted on geographies consisting of 452,889,147 people shows a significant positive correlation between the proportion of Immigrants from Canada and poverty level among children under the age of 16 in the United States with a correlation coefficient (R) of 0.601 and weighted average of 14.5%. Similarly, the statistical analysis conducted on geographies consisting of 559,388,012 people shows a substantial positive correlation between the proportion of French and poverty level among children under the age of 16 in the United States with a correlation coefficient (R) of 0.504 and weighted average of 15.6%, a difference of 7.5%.
Child Poverty Under the Age of 16 Correlation Summary
| Measurement | Immigrants from Canada | French |
| Minimum | 10.3% | 5.0% |
| Maximum | 100.0% | 100.0% |
| Range | 89.7% | 95.0% |
| Mean | 34.3% | 22.2% |
| Median | 22.6% | 18.4% |
| Interquartile 25% (IQ1) | 14.9% | 14.7% |
| Interquartile 75% (IQ3) | 37.1% | 23.7% |
| Interquartile Range (IQR) | 22.2% | 9.0% |
| Standard Deviation (Sample) | 28.1% | 15.8% |
| Standard Deviation (Population) | 27.7% | 15.7% |
Similar Demographics by Child Poverty Under the Age of 16
Demographics Similar to Immigrants from Canada by Child Poverty Under the Age of 16
In terms of child poverty under the age of 16, the demographic groups most similar to Immigrants from Canada are Finnish (14.5%, a difference of 0.030%), Egyptian (14.5%, a difference of 0.030%), Immigrants from Latvia (14.5%, a difference of 0.050%), Immigrants from North Macedonia (14.5%, a difference of 0.060%), and Soviet Union (14.5%, a difference of 0.070%).
| Demographics | Rating | Rank | Child Poverty Under the Age of 16 |
| Ukrainians | 97.5 /100 | #75 | Exceptional 14.4% |
| Immigrants | Eastern Europe | 97.5 /100 | #76 | Exceptional 14.4% |
| Australians | 97.5 /100 | #77 | Exceptional 14.4% |
| Immigrants | Russia | 97.3 /100 | #78 | Exceptional 14.5% |
| Swiss | 97.3 /100 | #79 | Exceptional 14.5% |
| Immigrants | North Macedonia | 97.2 /100 | #80 | Exceptional 14.5% |
| Finns | 97.2 /100 | #81 | Exceptional 14.5% |
| Immigrants | Canada | 97.2 /100 | #82 | Exceptional 14.5% |
| Egyptians | 97.2 /100 | #83 | Exceptional 14.5% |
| Immigrants | Latvia | 97.1 /100 | #84 | Exceptional 14.5% |
| Soviet Union | 97.1 /100 | #85 | Exceptional 14.5% |
| Immigrants | Argentina | 97.1 /100 | #86 | Exceptional 14.5% |
| Taiwanese | 97.1 /100 | #87 | Exceptional 14.5% |
| Northern Europeans | 97.0 /100 | #88 | Exceptional 14.5% |
| Germans | 96.9 /100 | #89 | Exceptional 14.5% |
Demographics Similar to French by Child Poverty Under the Age of 16
In terms of child poverty under the age of 16, the demographic groups most similar to French are Immigrants from Jordan (15.6%, a difference of 0.0%), French Canadian (15.6%, a difference of 0.040%), Venezuelan (15.6%, a difference of 0.18%), Samoan (15.6%, a difference of 0.22%), and Israeli (15.5%, a difference of 0.32%).
| Demographics | Rating | Rank | Child Poverty Under the Age of 16 |
| Immigrants | Hungary | 81.9 /100 | #144 | Excellent 15.5% |
| Immigrants | Peru | 81.7 /100 | #145 | Excellent 15.5% |
| Slovaks | 81.4 /100 | #146 | Excellent 15.5% |
| Immigrants | Kuwait | 80.5 /100 | #147 | Excellent 15.5% |
| Puget Sound Salish | 80.3 /100 | #148 | Excellent 15.5% |
| Israelis | 80.1 /100 | #149 | Excellent 15.5% |
| Immigrants | Jordan | 78.5 /100 | #150 | Good 15.6% |
| French | 78.5 /100 | #151 | Good 15.6% |
| French Canadians | 78.2 /100 | #152 | Good 15.6% |
| Venezuelans | 77.4 /100 | #153 | Good 15.6% |
| Samoans | 77.3 /100 | #154 | Good 15.6% |
| Syrians | 76.1 /100 | #155 | Good 15.6% |
| Immigrants | Venezuela | 74.9 /100 | #156 | Good 15.7% |
| Immigrants | Nepal | 72.9 /100 | #157 | Good 15.7% |
| Immigrants | Chile | 72.8 /100 | #158 | Good 15.7% |