Filipino vs French Median Female Earnings
COMPARE
Filipino
French
Median Female Earnings
Median Female Earnings Comparison
Filipinos
French
$49,508
MEDIAN FEMALE EARNINGS
100.0/ 100
METRIC RATING
2nd/ 347
METRIC RANK
$38,457
MEDIAN FEMALE EARNINGS
7.0/ 100
METRIC RATING
225th/ 347
METRIC RANK
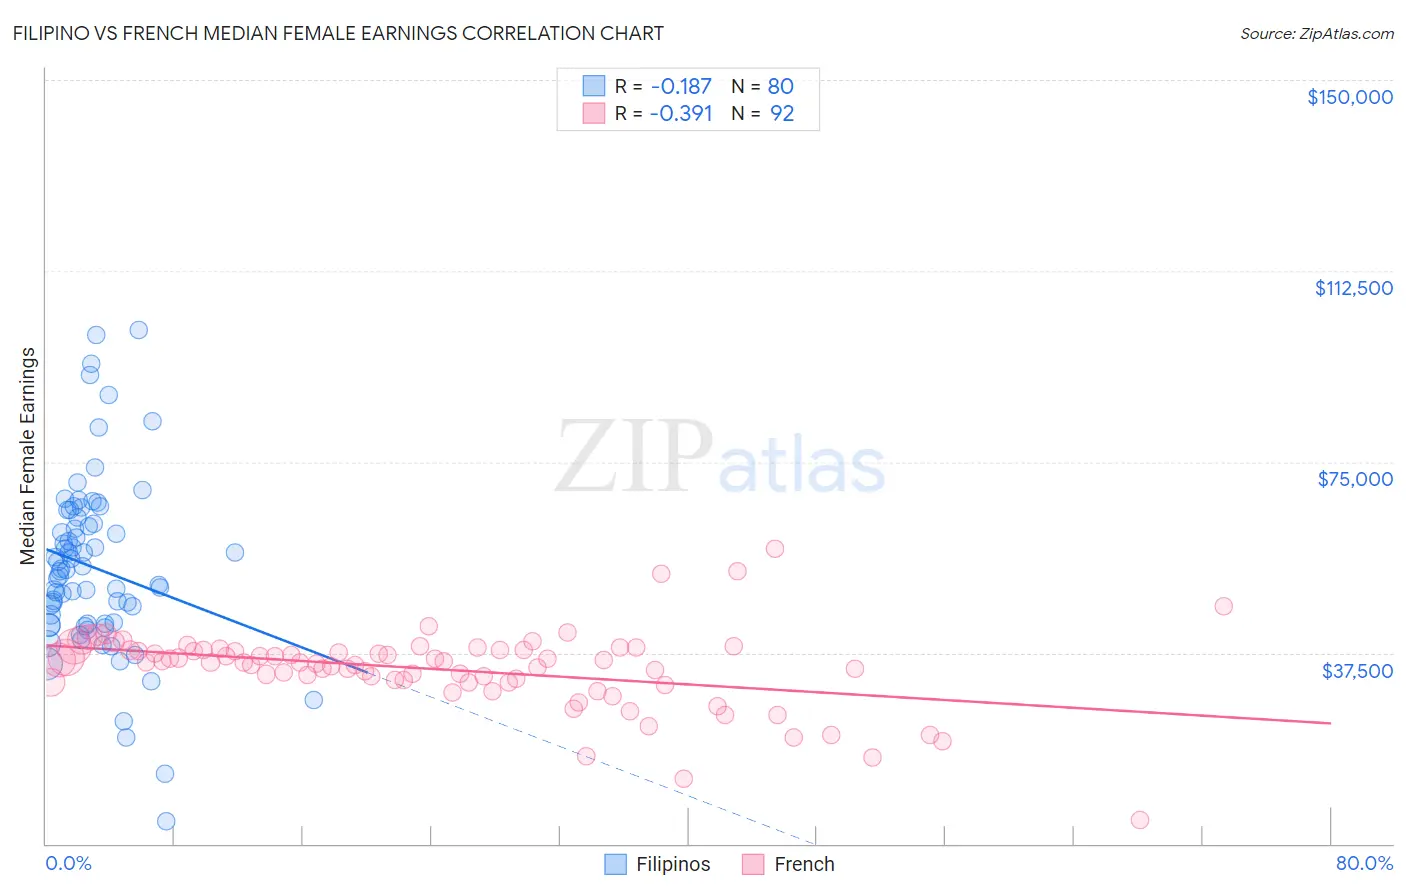
Filipino vs French Median Female Earnings Correlation Chart
The statistical analysis conducted on geographies consisting of 254,323,298 people shows a poor negative correlation between the proportion of Filipinos and median female earnings in the United States with a correlation coefficient (R) of -0.187 and weighted average of $49,508. Similarly, the statistical analysis conducted on geographies consisting of 570,640,239 people shows a mild negative correlation between the proportion of French and median female earnings in the United States with a correlation coefficient (R) of -0.391 and weighted average of $38,457, a difference of 28.7%.
Median Female Earnings Correlation Summary
| Measurement | Filipino | French |
| Minimum | $4,500 | $4,625 |
| Maximum | $100,821 | $58,008 |
| Range | $96,321 | $53,383 |
| Mean | $54,231 | $34,289 |
| Median | $53,668 | $35,683 |
| Interquartile 25% (IQ1) | $43,160 | $31,891 |
| Interquartile 75% (IQ3) | $63,449 | $38,063 |
| Interquartile Range (IQR) | $20,289 | $6,171 |
| Standard Deviation (Sample) | $17,351 | $7,750 |
| Standard Deviation (Population) | $17,242 | $7,708 |
Similar Demographics by Median Female Earnings
Demographics Similar to Filipinos by Median Female Earnings
In terms of median female earnings, the demographic groups most similar to Filipinos are Immigrants from Taiwan ($49,256, a difference of 0.51%), Immigrants from Hong Kong ($49,818, a difference of 0.63%), Immigrants from India ($48,292, a difference of 2.5%), Immigrants from Singapore ($47,986, a difference of 3.2%), and Immigrants from Ireland ($47,598, a difference of 4.0%).
| Demographics | Rating | Rank | Median Female Earnings |
| Immigrants | Hong Kong | 100.0 /100 | #1 | Exceptional $49,818 |
| Filipinos | 100.0 /100 | #2 | Exceptional $49,508 |
| Immigrants | Taiwan | 100.0 /100 | #3 | Exceptional $49,256 |
| Immigrants | India | 100.0 /100 | #4 | Exceptional $48,292 |
| Immigrants | Singapore | 100.0 /100 | #5 | Exceptional $47,986 |
| Immigrants | Ireland | 100.0 /100 | #6 | Exceptional $47,598 |
| Thais | 100.0 /100 | #7 | Exceptional $47,577 |
| Iranians | 100.0 /100 | #8 | Exceptional $47,421 |
| Immigrants | Iran | 100.0 /100 | #9 | Exceptional $47,154 |
| Immigrants | China | 100.0 /100 | #10 | Exceptional $46,972 |
| Okinawans | 100.0 /100 | #11 | Exceptional $46,905 |
| Immigrants | Israel | 100.0 /100 | #12 | Exceptional $46,902 |
| Immigrants | Australia | 100.0 /100 | #13 | Exceptional $46,573 |
| Soviet Union | 100.0 /100 | #14 | Exceptional $46,556 |
| Immigrants | Eastern Asia | 100.0 /100 | #15 | Exceptional $46,502 |
Demographics Similar to French by Median Female Earnings
In terms of median female earnings, the demographic groups most similar to French are Native Hawaiian ($38,461, a difference of 0.010%), French Canadian ($38,436, a difference of 0.050%), Immigrants from Sudan ($38,511, a difference of 0.14%), Scottish ($38,397, a difference of 0.15%), and Subsaharan African ($38,391, a difference of 0.17%).
| Demographics | Rating | Rank | Median Female Earnings |
| Cape Verdeans | 9.5 /100 | #218 | Tragic $38,614 |
| Nepalese | 9.3 /100 | #219 | Tragic $38,603 |
| Yugoslavians | 8.8 /100 | #220 | Tragic $38,573 |
| Immigrants | Azores | 8.8 /100 | #221 | Tragic $38,573 |
| Japanese | 8.1 /100 | #222 | Tragic $38,528 |
| Immigrants | Sudan | 7.8 /100 | #223 | Tragic $38,511 |
| Native Hawaiians | 7.1 /100 | #224 | Tragic $38,461 |
| French | 7.0 /100 | #225 | Tragic $38,457 |
| French Canadians | 6.8 /100 | #226 | Tragic $38,436 |
| Scottish | 6.3 /100 | #227 | Tragic $38,397 |
| Sub-Saharan Africans | 6.2 /100 | #228 | Tragic $38,391 |
| Belgians | 6.1 /100 | #229 | Tragic $38,382 |
| Basques | 5.7 /100 | #230 | Tragic $38,352 |
| Somalis | 5.5 /100 | #231 | Tragic $38,333 |
| Scandinavians | 5.2 /100 | #232 | Tragic $38,306 |