Immigrants from Cameroon vs Portuguese Median Family Income
COMPARE
Immigrants from Cameroon
Portuguese
Median Family Income
Median Family Income Comparison
Immigrants from Cameroon
Portuguese
$100,289
MEDIAN FAMILY INCOME
22.8/ 100
METRIC RATING
197th/ 347
METRIC RANK
$106,286
MEDIAN FAMILY INCOME
86.3/ 100
METRIC RATING
135th/ 347
METRIC RANK
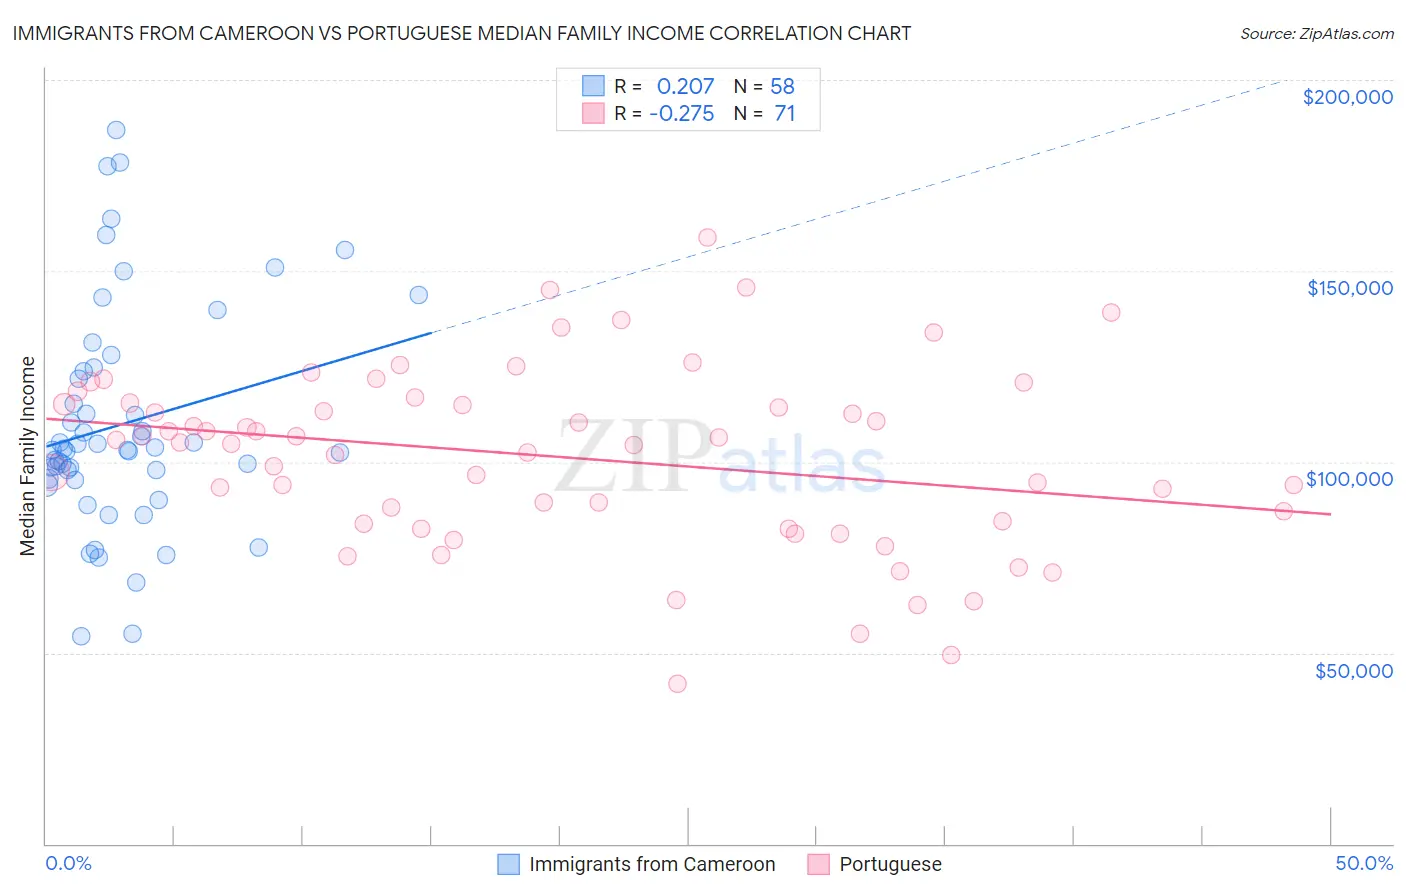
Immigrants from Cameroon vs Portuguese Median Family Income Correlation Chart
The statistical analysis conducted on geographies consisting of 130,726,829 people shows a weak positive correlation between the proportion of Immigrants from Cameroon and median family income in the United States with a correlation coefficient (R) of 0.207 and weighted average of $100,289. Similarly, the statistical analysis conducted on geographies consisting of 449,790,054 people shows a weak negative correlation between the proportion of Portuguese and median family income in the United States with a correlation coefficient (R) of -0.275 and weighted average of $106,286, a difference of 6.0%.
Median Family Income Correlation Summary
| Measurement | Immigrants from Cameroon | Portuguese |
| Minimum | $54,178 | $41,875 |
| Maximum | $186,802 | $158,667 |
| Range | $132,624 | $116,792 |
| Mean | $109,949 | $101,290 |
| Median | $103,317 | $105,008 |
| Interquartile 25% (IQ1) | $95,592 | $83,759 |
| Interquartile 75% (IQ3) | $123,784 | $115,390 |
| Interquartile Range (IQR) | $28,192 | $31,631 |
| Standard Deviation (Sample) | $29,032 | $23,601 |
| Standard Deviation (Population) | $28,780 | $23,434 |
Similar Demographics by Median Family Income
Demographics Similar to Immigrants from Cameroon by Median Family Income
In terms of median family income, the demographic groups most similar to Immigrants from Cameroon are Immigrants from Africa ($100,256, a difference of 0.030%), Samoan ($100,344, a difference of 0.060%), Immigrants from South America ($100,414, a difference of 0.12%), Yugoslavian ($100,119, a difference of 0.17%), and Spanish ($99,977, a difference of 0.31%).
| Demographics | Rating | Rank | Median Family Income |
| Immigrants | Immigrants | 29.4 /100 | #190 | Fair $100,962 |
| Colombians | 27.2 /100 | #191 | Fair $100,750 |
| Immigrants | Kenya | 26.5 /100 | #192 | Fair $100,679 |
| Iraqis | 26.3 /100 | #193 | Fair $100,658 |
| Uruguayans | 26.3 /100 | #194 | Fair $100,656 |
| Immigrants | South America | 23.9 /100 | #195 | Fair $100,414 |
| Samoans | 23.3 /100 | #196 | Fair $100,344 |
| Immigrants | Cameroon | 22.8 /100 | #197 | Fair $100,289 |
| Immigrants | Africa | 22.5 /100 | #198 | Fair $100,256 |
| Yugoslavians | 21.3 /100 | #199 | Fair $100,119 |
| Spanish | 20.1 /100 | #200 | Fair $99,977 |
| Immigrants | Thailand | 19.0 /100 | #201 | Poor $99,840 |
| Whites/Caucasians | 18.7 /100 | #202 | Poor $99,800 |
| Scotch-Irish | 17.1 /100 | #203 | Poor $99,591 |
| Ghanaians | 12.6 /100 | #204 | Poor $98,877 |
Demographics Similar to Portuguese by Median Family Income
In terms of median family income, the demographic groups most similar to Portuguese are Immigrants from South Eastern Asia ($106,252, a difference of 0.030%), Immigrants from Uganda ($106,188, a difference of 0.090%), Immigrants from Vietnam ($106,186, a difference of 0.090%), Luxembourger ($106,183, a difference of 0.10%), and Norwegian ($106,144, a difference of 0.13%).
| Demographics | Rating | Rank | Median Family Income |
| Immigrants | Ethiopia | 90.0 /100 | #128 | Excellent $106,969 |
| Arabs | 89.9 /100 | #129 | Excellent $106,952 |
| Brazilians | 89.8 /100 | #130 | Excellent $106,942 |
| Canadians | 88.1 /100 | #131 | Excellent $106,597 |
| Immigrants | Fiji | 87.8 /100 | #132 | Excellent $106,544 |
| Ugandans | 87.8 /100 | #133 | Excellent $106,541 |
| Immigrants | Oceania | 87.3 /100 | #134 | Excellent $106,453 |
| Portuguese | 86.3 /100 | #135 | Excellent $106,286 |
| Immigrants | South Eastern Asia | 86.1 /100 | #136 | Excellent $106,252 |
| Immigrants | Uganda | 85.7 /100 | #137 | Excellent $106,188 |
| Immigrants | Vietnam | 85.7 /100 | #138 | Excellent $106,186 |
| Luxembourgers | 85.7 /100 | #139 | Excellent $106,183 |
| Norwegians | 85.5 /100 | #140 | Excellent $106,144 |
| Immigrants | Syria | 85.3 /100 | #141 | Excellent $106,118 |
| Slovenes | 84.7 /100 | #142 | Excellent $106,020 |