Immigrants from Cameroon vs Welsh Median Family Income
COMPARE
Immigrants from Cameroon
Welsh
Median Family Income
Median Family Income Comparison
Immigrants from Cameroon
Welsh
$100,289
MEDIAN FAMILY INCOME
22.8/ 100
METRIC RATING
197th/ 347
METRIC RANK
$102,151
MEDIAN FAMILY INCOME
43.3/ 100
METRIC RATING
178th/ 347
METRIC RANK
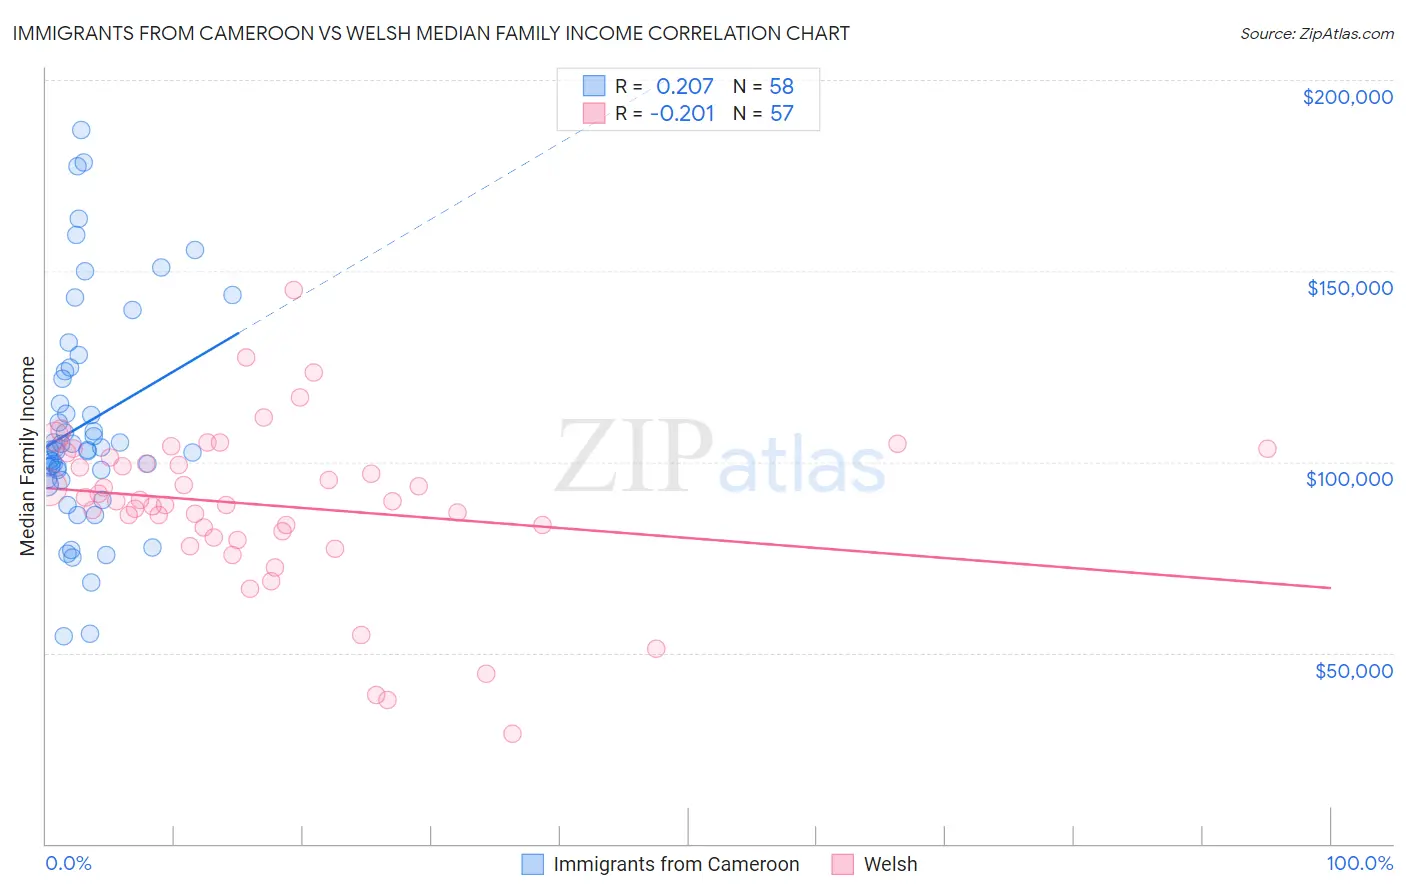
Immigrants from Cameroon vs Welsh Median Family Income Correlation Chart
The statistical analysis conducted on geographies consisting of 130,726,829 people shows a weak positive correlation between the proportion of Immigrants from Cameroon and median family income in the United States with a correlation coefficient (R) of 0.207 and weighted average of $100,289. Similarly, the statistical analysis conducted on geographies consisting of 527,824,493 people shows a weak negative correlation between the proportion of Welsh and median family income in the United States with a correlation coefficient (R) of -0.201 and weighted average of $102,151, a difference of 1.9%.
Median Family Income Correlation Summary
| Measurement | Immigrants from Cameroon | Welsh |
| Minimum | $54,178 | $28,750 |
| Maximum | $186,802 | $145,055 |
| Range | $132,624 | $116,305 |
| Mean | $109,949 | $88,686 |
| Median | $103,317 | $89,832 |
| Interquartile 25% (IQ1) | $95,592 | $80,992 |
| Interquartile 75% (IQ3) | $123,784 | $101,775 |
| Interquartile Range (IQR) | $28,192 | $20,783 |
| Standard Deviation (Sample) | $29,032 | $21,326 |
| Standard Deviation (Population) | $28,780 | $21,138 |
Demographics Similar to Immigrants from Cameroon and Welsh by Median Family Income
In terms of median family income, the demographic groups most similar to Immigrants from Cameroon are Samoan ($100,344, a difference of 0.060%), Immigrants from South America ($100,414, a difference of 0.12%), Iraqi ($100,658, a difference of 0.37%), Uruguayan ($100,656, a difference of 0.37%), and Immigrants from Kenya ($100,679, a difference of 0.39%). Similarly, the demographic groups most similar to Welsh are German ($102,254, a difference of 0.10%), South American ($101,856, a difference of 0.29%), French Canadian ($101,634, a difference of 0.51%), Spaniard ($101,617, a difference of 0.52%), and Tsimshian ($101,543, a difference of 0.60%).
| Demographics | Rating | Rank | Median Family Income |
| Germans | 44.6 /100 | #177 | Average $102,254 |
| Welsh | 43.3 /100 | #178 | Average $102,151 |
| South Americans | 39.7 /100 | #179 | Fair $101,856 |
| French Canadians | 37.0 /100 | #180 | Fair $101,634 |
| Spaniards | 36.8 /100 | #181 | Fair $101,617 |
| Tsimshian | 35.9 /100 | #182 | Fair $101,543 |
| Kenyans | 34.5 /100 | #183 | Fair $101,417 |
| Immigrants | Costa Rica | 33.7 /100 | #184 | Fair $101,354 |
| Dutch | 31.9 /100 | #185 | Fair $101,192 |
| Celtics | 31.3 /100 | #186 | Fair $101,139 |
| Tlingit-Haida | 30.8 /100 | #187 | Fair $101,092 |
| Guamanians/Chamorros | 30.5 /100 | #188 | Fair $101,061 |
| Immigrants | Portugal | 29.6 /100 | #189 | Fair $100,984 |
| Immigrants | Immigrants | 29.4 /100 | #190 | Fair $100,962 |
| Colombians | 27.2 /100 | #191 | Fair $100,750 |
| Immigrants | Kenya | 26.5 /100 | #192 | Fair $100,679 |
| Iraqis | 26.3 /100 | #193 | Fair $100,658 |
| Uruguayans | 26.3 /100 | #194 | Fair $100,656 |
| Immigrants | South America | 23.9 /100 | #195 | Fair $100,414 |
| Samoans | 23.3 /100 | #196 | Fair $100,344 |
| Immigrants | Cameroon | 22.8 /100 | #197 | Fair $100,289 |