Immigrants from Cambodia vs Okinawan Median Earnings
COMPARE
Immigrants from Cambodia
Okinawan
Median Earnings
Median Earnings Comparison
Immigrants from Cambodia
Okinawans
$45,090
MEDIAN EARNINGS
13.2/ 100
METRIC RATING
225th/ 347
METRIC RANK
$57,550
MEDIAN EARNINGS
100.0/ 100
METRIC RATING
9th/ 347
METRIC RANK
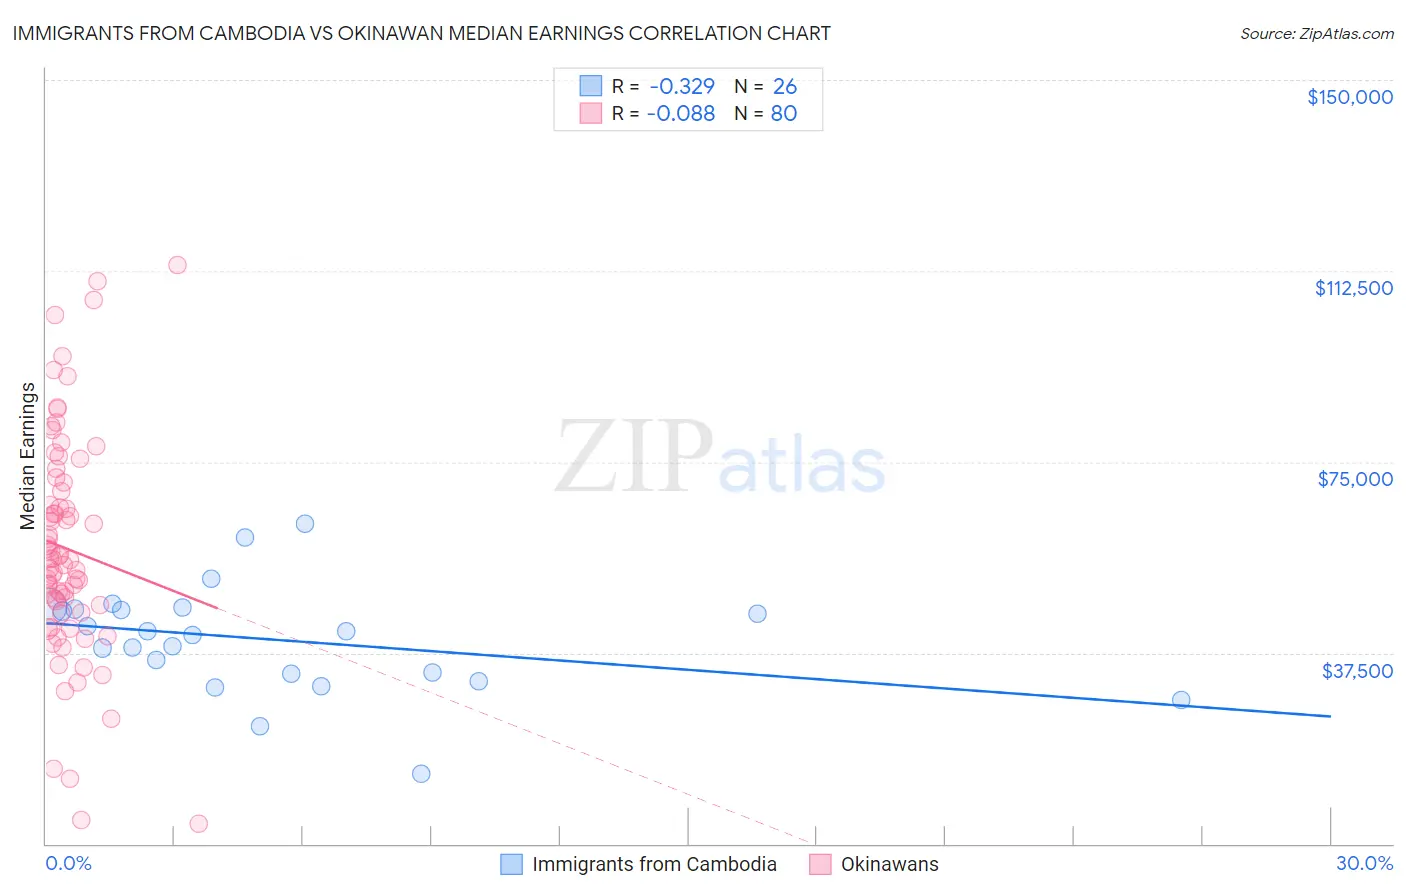
Immigrants from Cambodia vs Okinawan Median Earnings Correlation Chart
The statistical analysis conducted on geographies consisting of 205,155,765 people shows a mild negative correlation between the proportion of Immigrants from Cambodia and median earnings in the United States with a correlation coefficient (R) of -0.329 and weighted average of $45,090. Similarly, the statistical analysis conducted on geographies consisting of 73,779,677 people shows a slight negative correlation between the proportion of Okinawans and median earnings in the United States with a correlation coefficient (R) of -0.088 and weighted average of $57,550, a difference of 27.6%.
Median Earnings Correlation Summary
| Measurement | Immigrants from Cambodia | Okinawan |
| Minimum | $13,852 | $4,007 |
| Maximum | $62,969 | $113,728 |
| Range | $49,117 | $109,721 |
| Mean | $40,126 | $57,919 |
| Median | $41,377 | $55,875 |
| Interquartile 25% (IQ1) | $33,437 | $46,156 |
| Interquartile 75% (IQ3) | $46,102 | $70,001 |
| Interquartile Range (IQR) | $12,665 | $23,845 |
| Standard Deviation (Sample) | $10,590 | $21,992 |
| Standard Deviation (Population) | $10,384 | $21,854 |
Similar Demographics by Median Earnings
Demographics Similar to Immigrants from Cambodia by Median Earnings
In terms of median earnings, the demographic groups most similar to Immigrants from Cambodia are West Indian ($45,132, a difference of 0.090%), Immigrants from Nigeria ($45,030, a difference of 0.13%), Native Hawaiian ($45,027, a difference of 0.14%), Immigrants from Iraq ($44,988, a difference of 0.22%), and Immigrants from Panama ($45,198, a difference of 0.24%).
| Demographics | Rating | Rank | Median Earnings |
| Spanish | 19.7 /100 | #218 | Poor $45,432 |
| Dutch | 18.4 /100 | #219 | Poor $45,370 |
| Ecuadorians | 15.3 /100 | #220 | Poor $45,214 |
| Immigrants | Guyana | 15.1 /100 | #221 | Poor $45,204 |
| Immigrants | Panama | 15.0 /100 | #222 | Poor $45,198 |
| Whites/Caucasians | 15.0 /100 | #223 | Poor $45,197 |
| West Indians | 13.9 /100 | #224 | Poor $45,132 |
| Immigrants | Cambodia | 13.2 /100 | #225 | Poor $45,090 |
| Immigrants | Nigeria | 12.2 /100 | #226 | Poor $45,030 |
| Native Hawaiians | 12.2 /100 | #227 | Poor $45,027 |
| Immigrants | Iraq | 11.6 /100 | #228 | Poor $44,988 |
| Scotch-Irish | 10.7 /100 | #229 | Poor $44,924 |
| Immigrants | Western Africa | 10.3 /100 | #230 | Poor $44,893 |
| Japanese | 9.5 /100 | #231 | Tragic $44,825 |
| Delaware | 9.0 /100 | #232 | Tragic $44,783 |
Demographics Similar to Okinawans by Median Earnings
In terms of median earnings, the demographic groups most similar to Okinawans are Immigrants from Iran ($57,612, a difference of 0.11%), Immigrants from South Central Asia ($57,114, a difference of 0.76%), Immigrants from Israel ($57,034, a difference of 0.90%), Immigrants from Ireland ($56,854, a difference of 1.2%), and Iranian ($58,474, a difference of 1.6%).
| Demographics | Rating | Rank | Median Earnings |
| Immigrants | Taiwan | 100.0 /100 | #2 | Exceptional $61,151 |
| Immigrants | India | 100.0 /100 | #3 | Exceptional $60,648 |
| Immigrants | Hong Kong | 100.0 /100 | #4 | Exceptional $59,433 |
| Thais | 100.0 /100 | #5 | Exceptional $59,237 |
| Immigrants | Singapore | 100.0 /100 | #6 | Exceptional $59,038 |
| Iranians | 100.0 /100 | #7 | Exceptional $58,474 |
| Immigrants | Iran | 100.0 /100 | #8 | Exceptional $57,612 |
| Okinawans | 100.0 /100 | #9 | Exceptional $57,550 |
| Immigrants | South Central Asia | 100.0 /100 | #10 | Exceptional $57,114 |
| Immigrants | Israel | 100.0 /100 | #11 | Exceptional $57,034 |
| Immigrants | Ireland | 100.0 /100 | #12 | Exceptional $56,854 |
| Immigrants | China | 100.0 /100 | #13 | Exceptional $56,638 |
| Immigrants | Australia | 100.0 /100 | #14 | Exceptional $56,305 |
| Indians (Asian) | 100.0 /100 | #15 | Exceptional $56,253 |
| Immigrants | Eastern Asia | 100.0 /100 | #16 | Exceptional $56,183 |