Immigrants from Ecuador vs Okinawan Median Earnings
COMPARE
Immigrants from Ecuador
Okinawan
Median Earnings
Median Earnings Comparison
Immigrants from Ecuador
Okinawans
$44,462
MEDIAN EARNINGS
5.9/ 100
METRIC RATING
237th/ 347
METRIC RANK
$57,550
MEDIAN EARNINGS
100.0/ 100
METRIC RATING
9th/ 347
METRIC RANK
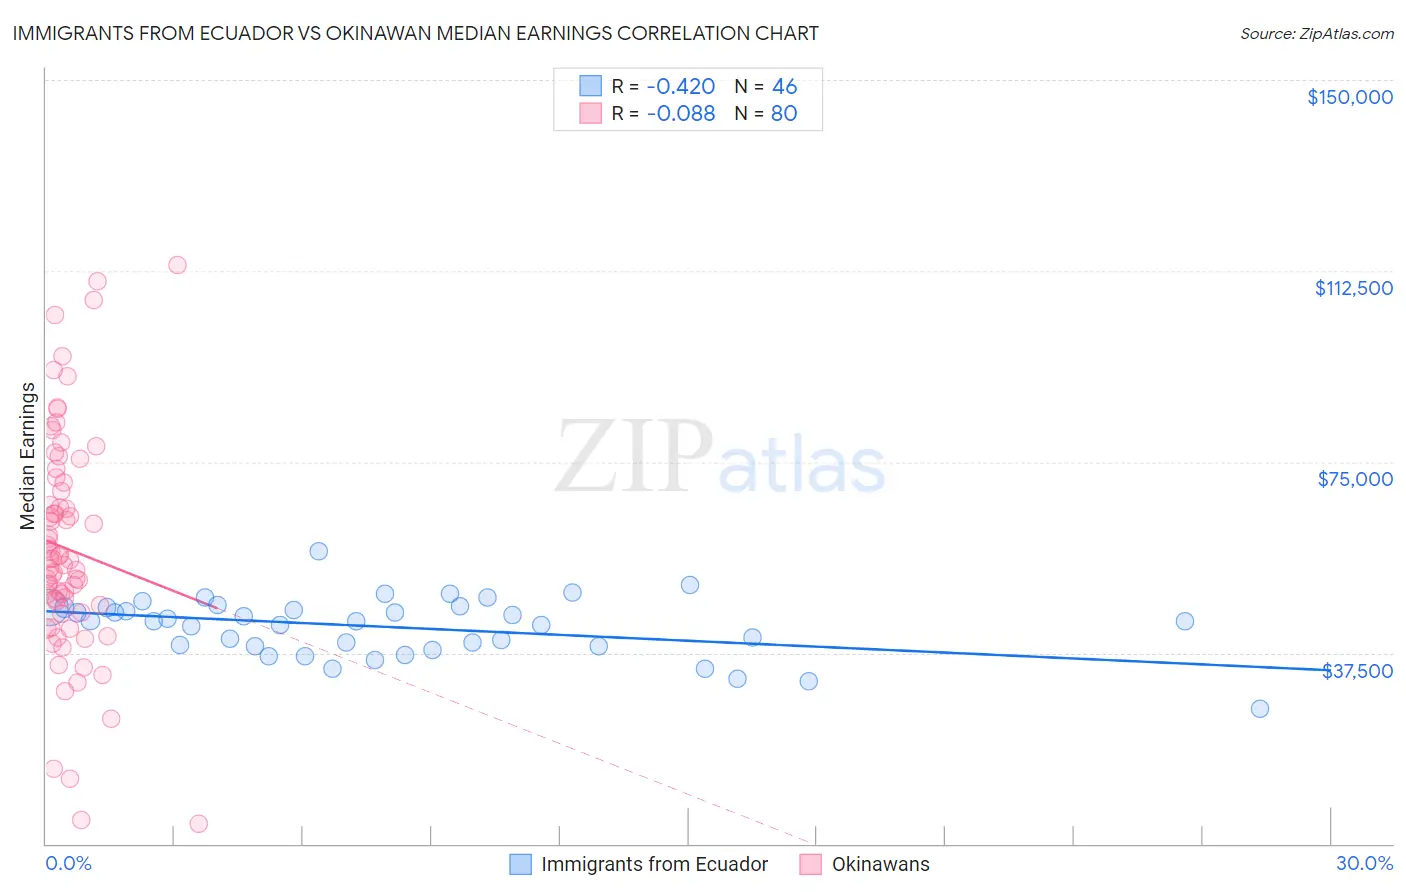
Immigrants from Ecuador vs Okinawan Median Earnings Correlation Chart
The statistical analysis conducted on geographies consisting of 271,003,938 people shows a moderate negative correlation between the proportion of Immigrants from Ecuador and median earnings in the United States with a correlation coefficient (R) of -0.420 and weighted average of $44,462. Similarly, the statistical analysis conducted on geographies consisting of 73,779,677 people shows a slight negative correlation between the proportion of Okinawans and median earnings in the United States with a correlation coefficient (R) of -0.088 and weighted average of $57,550, a difference of 29.4%.
Median Earnings Correlation Summary
| Measurement | Immigrants from Ecuador | Okinawan |
| Minimum | $26,500 | $4,007 |
| Maximum | $57,428 | $113,728 |
| Range | $30,928 | $109,721 |
| Mean | $42,586 | $57,919 |
| Median | $43,711 | $55,875 |
| Interquartile 25% (IQ1) | $38,859 | $46,156 |
| Interquartile 75% (IQ3) | $46,439 | $70,001 |
| Interquartile Range (IQR) | $7,579 | $23,845 |
| Standard Deviation (Sample) | $5,767 | $21,992 |
| Standard Deviation (Population) | $5,704 | $21,854 |
Similar Demographics by Median Earnings
Demographics Similar to Immigrants from Ecuador by Median Earnings
In terms of median earnings, the demographic groups most similar to Immigrants from Ecuador are Sudanese ($44,419, a difference of 0.10%), British West Indian ($44,552, a difference of 0.20%), Senegalese ($44,373, a difference of 0.20%), Venezuelan ($44,580, a difference of 0.27%), and Cape Verdean ($44,640, a difference of 0.40%).
| Demographics | Rating | Rank | Median Earnings |
| Immigrants | Western Africa | 10.3 /100 | #230 | Poor $44,893 |
| Japanese | 9.5 /100 | #231 | Tragic $44,825 |
| Delaware | 9.0 /100 | #232 | Tragic $44,783 |
| Immigrants | Sudan | 8.8 /100 | #233 | Tragic $44,767 |
| Cape Verdeans | 7.5 /100 | #234 | Tragic $44,640 |
| Venezuelans | 6.9 /100 | #235 | Tragic $44,580 |
| British West Indians | 6.7 /100 | #236 | Tragic $44,552 |
| Immigrants | Ecuador | 5.9 /100 | #237 | Tragic $44,462 |
| Sudanese | 5.6 /100 | #238 | Tragic $44,419 |
| Senegalese | 5.3 /100 | #239 | Tragic $44,373 |
| Aleuts | 4.4 /100 | #240 | Tragic $44,241 |
| Samoans | 4.2 /100 | #241 | Tragic $44,206 |
| Immigrants | Venezuela | 4.0 /100 | #242 | Tragic $44,163 |
| Sub-Saharan Africans | 3.7 /100 | #243 | Tragic $44,118 |
| Immigrants | Nonimmigrants | 3.7 /100 | #244 | Tragic $44,117 |
Demographics Similar to Okinawans by Median Earnings
In terms of median earnings, the demographic groups most similar to Okinawans are Immigrants from Iran ($57,612, a difference of 0.11%), Immigrants from South Central Asia ($57,114, a difference of 0.76%), Immigrants from Israel ($57,034, a difference of 0.90%), Immigrants from Ireland ($56,854, a difference of 1.2%), and Iranian ($58,474, a difference of 1.6%).
| Demographics | Rating | Rank | Median Earnings |
| Immigrants | Taiwan | 100.0 /100 | #2 | Exceptional $61,151 |
| Immigrants | India | 100.0 /100 | #3 | Exceptional $60,648 |
| Immigrants | Hong Kong | 100.0 /100 | #4 | Exceptional $59,433 |
| Thais | 100.0 /100 | #5 | Exceptional $59,237 |
| Immigrants | Singapore | 100.0 /100 | #6 | Exceptional $59,038 |
| Iranians | 100.0 /100 | #7 | Exceptional $58,474 |
| Immigrants | Iran | 100.0 /100 | #8 | Exceptional $57,612 |
| Okinawans | 100.0 /100 | #9 | Exceptional $57,550 |
| Immigrants | South Central Asia | 100.0 /100 | #10 | Exceptional $57,114 |
| Immigrants | Israel | 100.0 /100 | #11 | Exceptional $57,034 |
| Immigrants | Ireland | 100.0 /100 | #12 | Exceptional $56,854 |
| Immigrants | China | 100.0 /100 | #13 | Exceptional $56,638 |
| Immigrants | Australia | 100.0 /100 | #14 | Exceptional $56,305 |
| Indians (Asian) | 100.0 /100 | #15 | Exceptional $56,253 |
| Immigrants | Eastern Asia | 100.0 /100 | #16 | Exceptional $56,183 |