Immigrants from Cambodia vs South African Median Earnings
COMPARE
Immigrants from Cambodia
South African
Median Earnings
Median Earnings Comparison
Immigrants from Cambodia
South Africans
$45,090
MEDIAN EARNINGS
13.2/ 100
METRIC RATING
225th/ 347
METRIC RANK
$50,752
MEDIAN EARNINGS
99.8/ 100
METRIC RATING
74th/ 347
METRIC RANK
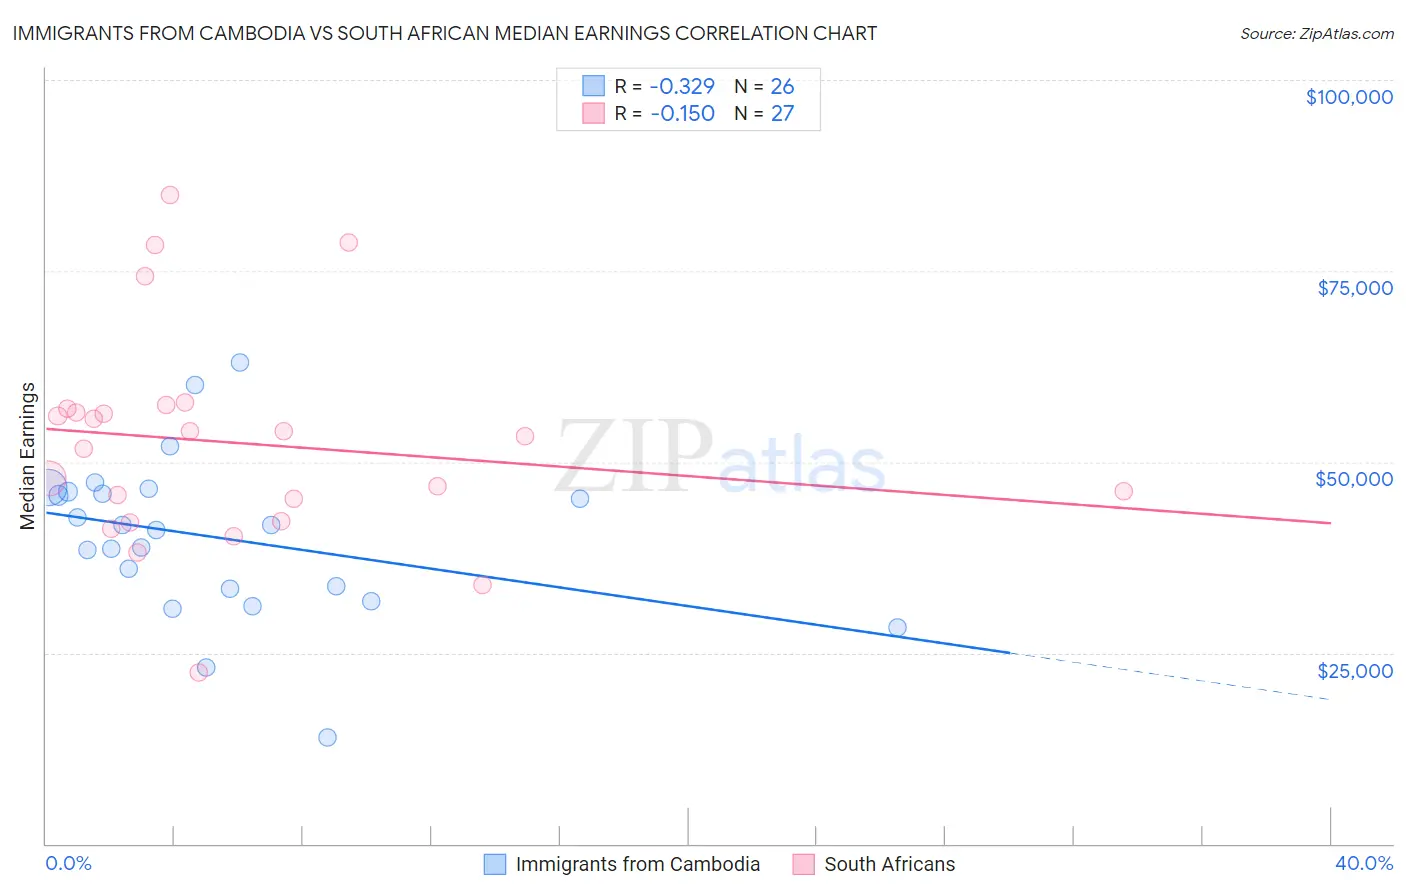
Immigrants from Cambodia vs South African Median Earnings Correlation Chart
The statistical analysis conducted on geographies consisting of 205,155,765 people shows a mild negative correlation between the proportion of Immigrants from Cambodia and median earnings in the United States with a correlation coefficient (R) of -0.329 and weighted average of $45,090. Similarly, the statistical analysis conducted on geographies consisting of 182,600,845 people shows a poor negative correlation between the proportion of South Africans and median earnings in the United States with a correlation coefficient (R) of -0.150 and weighted average of $50,752, a difference of 12.6%.
Median Earnings Correlation Summary
| Measurement | Immigrants from Cambodia | South African |
| Minimum | $13,852 | $22,500 |
| Maximum | $62,969 | $84,919 |
| Range | $49,117 | $62,419 |
| Mean | $40,126 | $52,531 |
| Median | $41,377 | $53,417 |
| Interquartile 25% (IQ1) | $33,437 | $42,247 |
| Interquartile 75% (IQ3) | $46,102 | $56,939 |
| Interquartile Range (IQR) | $12,665 | $14,692 |
| Standard Deviation (Sample) | $10,590 | $14,077 |
| Standard Deviation (Population) | $10,384 | $13,814 |
Similar Demographics by Median Earnings
Demographics Similar to Immigrants from Cambodia by Median Earnings
In terms of median earnings, the demographic groups most similar to Immigrants from Cambodia are West Indian ($45,132, a difference of 0.090%), Immigrants from Nigeria ($45,030, a difference of 0.13%), Native Hawaiian ($45,027, a difference of 0.14%), Immigrants from Iraq ($44,988, a difference of 0.22%), and Immigrants from Panama ($45,198, a difference of 0.24%).
| Demographics | Rating | Rank | Median Earnings |
| Spanish | 19.7 /100 | #218 | Poor $45,432 |
| Dutch | 18.4 /100 | #219 | Poor $45,370 |
| Ecuadorians | 15.3 /100 | #220 | Poor $45,214 |
| Immigrants | Guyana | 15.1 /100 | #221 | Poor $45,204 |
| Immigrants | Panama | 15.0 /100 | #222 | Poor $45,198 |
| Whites/Caucasians | 15.0 /100 | #223 | Poor $45,197 |
| West Indians | 13.9 /100 | #224 | Poor $45,132 |
| Immigrants | Cambodia | 13.2 /100 | #225 | Poor $45,090 |
| Immigrants | Nigeria | 12.2 /100 | #226 | Poor $45,030 |
| Native Hawaiians | 12.2 /100 | #227 | Poor $45,027 |
| Immigrants | Iraq | 11.6 /100 | #228 | Poor $44,988 |
| Scotch-Irish | 10.7 /100 | #229 | Poor $44,924 |
| Immigrants | Western Africa | 10.3 /100 | #230 | Poor $44,893 |
| Japanese | 9.5 /100 | #231 | Tragic $44,825 |
| Delaware | 9.0 /100 | #232 | Tragic $44,783 |
Demographics Similar to South Africans by Median Earnings
In terms of median earnings, the demographic groups most similar to South Africans are Immigrants from Scotland ($50,741, a difference of 0.020%), Immigrants from Netherlands ($50,818, a difference of 0.13%), Immigrants from Egypt ($50,901, a difference of 0.29%), Immigrants from Italy ($50,581, a difference of 0.34%), and Immigrants from Western Europe ($50,549, a difference of 0.40%).
| Demographics | Rating | Rank | Median Earnings |
| Immigrants | Spain | 99.9 /100 | #67 | Exceptional $51,092 |
| Paraguayans | 99.9 /100 | #68 | Exceptional $51,068 |
| Mongolians | 99.8 /100 | #69 | Exceptional $51,038 |
| Lithuanians | 99.8 /100 | #70 | Exceptional $50,991 |
| Immigrants | Ukraine | 99.8 /100 | #71 | Exceptional $50,984 |
| Immigrants | Egypt | 99.8 /100 | #72 | Exceptional $50,901 |
| Immigrants | Netherlands | 99.8 /100 | #73 | Exceptional $50,818 |
| South Africans | 99.8 /100 | #74 | Exceptional $50,752 |
| Immigrants | Scotland | 99.8 /100 | #75 | Exceptional $50,741 |
| Immigrants | Italy | 99.7 /100 | #76 | Exceptional $50,581 |
| Immigrants | Western Europe | 99.7 /100 | #77 | Exceptional $50,549 |
| Argentineans | 99.6 /100 | #78 | Exceptional $50,399 |
| Laotians | 99.6 /100 | #79 | Exceptional $50,343 |
| Ukrainians | 99.6 /100 | #80 | Exceptional $50,320 |
| Immigrants | Southern Europe | 99.6 /100 | #81 | Exceptional $50,280 |