Immigrants from Cambodia vs Pennsylvania German Median Earnings
COMPARE
Immigrants from Cambodia
Pennsylvania German
Median Earnings
Median Earnings Comparison
Immigrants from Cambodia
Pennsylvania Germans
$45,090
MEDIAN EARNINGS
13.2/ 100
METRIC RATING
225th/ 347
METRIC RANK
$42,615
MEDIAN EARNINGS
0.5/ 100
METRIC RATING
271st/ 347
METRIC RANK
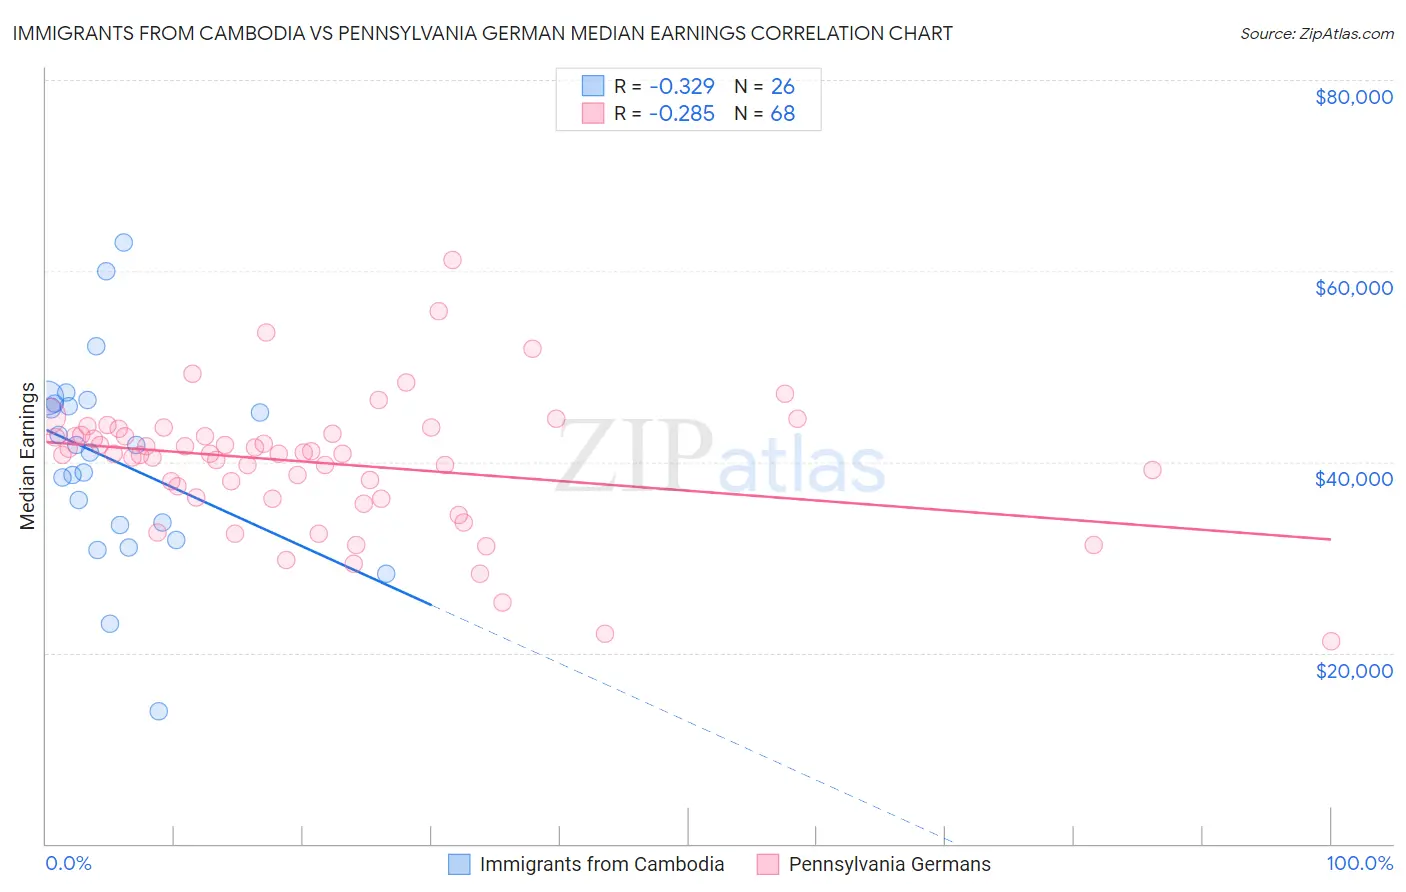
Immigrants from Cambodia vs Pennsylvania German Median Earnings Correlation Chart
The statistical analysis conducted on geographies consisting of 205,155,765 people shows a mild negative correlation between the proportion of Immigrants from Cambodia and median earnings in the United States with a correlation coefficient (R) of -0.329 and weighted average of $45,090. Similarly, the statistical analysis conducted on geographies consisting of 234,087,071 people shows a weak negative correlation between the proportion of Pennsylvania Germans and median earnings in the United States with a correlation coefficient (R) of -0.285 and weighted average of $42,615, a difference of 5.8%.
Median Earnings Correlation Summary
| Measurement | Immigrants from Cambodia | Pennsylvania German |
| Minimum | $13,852 | $21,250 |
| Maximum | $62,969 | $61,146 |
| Range | $49,117 | $39,896 |
| Mean | $40,126 | $39,881 |
| Median | $41,377 | $40,836 |
| Interquartile 25% (IQ1) | $33,437 | $36,214 |
| Interquartile 75% (IQ3) | $46,102 | $42,893 |
| Interquartile Range (IQR) | $12,665 | $6,679 |
| Standard Deviation (Sample) | $10,590 | $6,983 |
| Standard Deviation (Population) | $10,384 | $6,932 |
Similar Demographics by Median Earnings
Demographics Similar to Immigrants from Cambodia by Median Earnings
In terms of median earnings, the demographic groups most similar to Immigrants from Cambodia are West Indian ($45,132, a difference of 0.090%), Immigrants from Nigeria ($45,030, a difference of 0.13%), Native Hawaiian ($45,027, a difference of 0.14%), Immigrants from Iraq ($44,988, a difference of 0.22%), and Immigrants from Panama ($45,198, a difference of 0.24%).
| Demographics | Rating | Rank | Median Earnings |
| Spanish | 19.7 /100 | #218 | Poor $45,432 |
| Dutch | 18.4 /100 | #219 | Poor $45,370 |
| Ecuadorians | 15.3 /100 | #220 | Poor $45,214 |
| Immigrants | Guyana | 15.1 /100 | #221 | Poor $45,204 |
| Immigrants | Panama | 15.0 /100 | #222 | Poor $45,198 |
| Whites/Caucasians | 15.0 /100 | #223 | Poor $45,197 |
| West Indians | 13.9 /100 | #224 | Poor $45,132 |
| Immigrants | Cambodia | 13.2 /100 | #225 | Poor $45,090 |
| Immigrants | Nigeria | 12.2 /100 | #226 | Poor $45,030 |
| Native Hawaiians | 12.2 /100 | #227 | Poor $45,027 |
| Immigrants | Iraq | 11.6 /100 | #228 | Poor $44,988 |
| Scotch-Irish | 10.7 /100 | #229 | Poor $44,924 |
| Immigrants | Western Africa | 10.3 /100 | #230 | Poor $44,893 |
| Japanese | 9.5 /100 | #231 | Tragic $44,825 |
| Delaware | 9.0 /100 | #232 | Tragic $44,783 |
Demographics Similar to Pennsylvania Germans by Median Earnings
In terms of median earnings, the demographic groups most similar to Pennsylvania Germans are Osage ($42,651, a difference of 0.090%), Belizean ($42,702, a difference of 0.21%), American ($42,742, a difference of 0.30%), Cree ($42,777, a difference of 0.38%), and Iroquois ($42,430, a difference of 0.43%).
| Demographics | Rating | Rank | Median Earnings |
| Immigrants | Liberia | 0.7 /100 | #264 | Tragic $42,923 |
| Salvadorans | 0.7 /100 | #265 | Tragic $42,912 |
| Immigrants | Laos | 0.7 /100 | #266 | Tragic $42,884 |
| Cree | 0.6 /100 | #267 | Tragic $42,777 |
| Americans | 0.6 /100 | #268 | Tragic $42,742 |
| Belizeans | 0.5 /100 | #269 | Tragic $42,702 |
| Osage | 0.5 /100 | #270 | Tragic $42,651 |
| Pennsylvania Germans | 0.5 /100 | #271 | Tragic $42,615 |
| Iroquois | 0.4 /100 | #272 | Tragic $42,430 |
| Immigrants | Dominica | 0.4 /100 | #273 | Tragic $42,420 |
| Immigrants | El Salvador | 0.4 /100 | #274 | Tragic $42,413 |
| Immigrants | Belize | 0.3 /100 | #275 | Tragic $42,339 |
| Spanish Americans | 0.3 /100 | #276 | Tragic $42,316 |
| Central Americans | 0.3 /100 | #277 | Tragic $42,280 |
| Cajuns | 0.3 /100 | #278 | Tragic $42,189 |