Immigrants from South Eastern Asia vs Okinawan Median Earnings
COMPARE
Immigrants from South Eastern Asia
Okinawan
Median Earnings
Median Earnings Comparison
Immigrants from South Eastern Asia
Okinawans
$47,671
MEDIAN EARNINGS
85.0/ 100
METRIC RATING
147th/ 347
METRIC RANK
$57,550
MEDIAN EARNINGS
100.0/ 100
METRIC RATING
9th/ 347
METRIC RANK
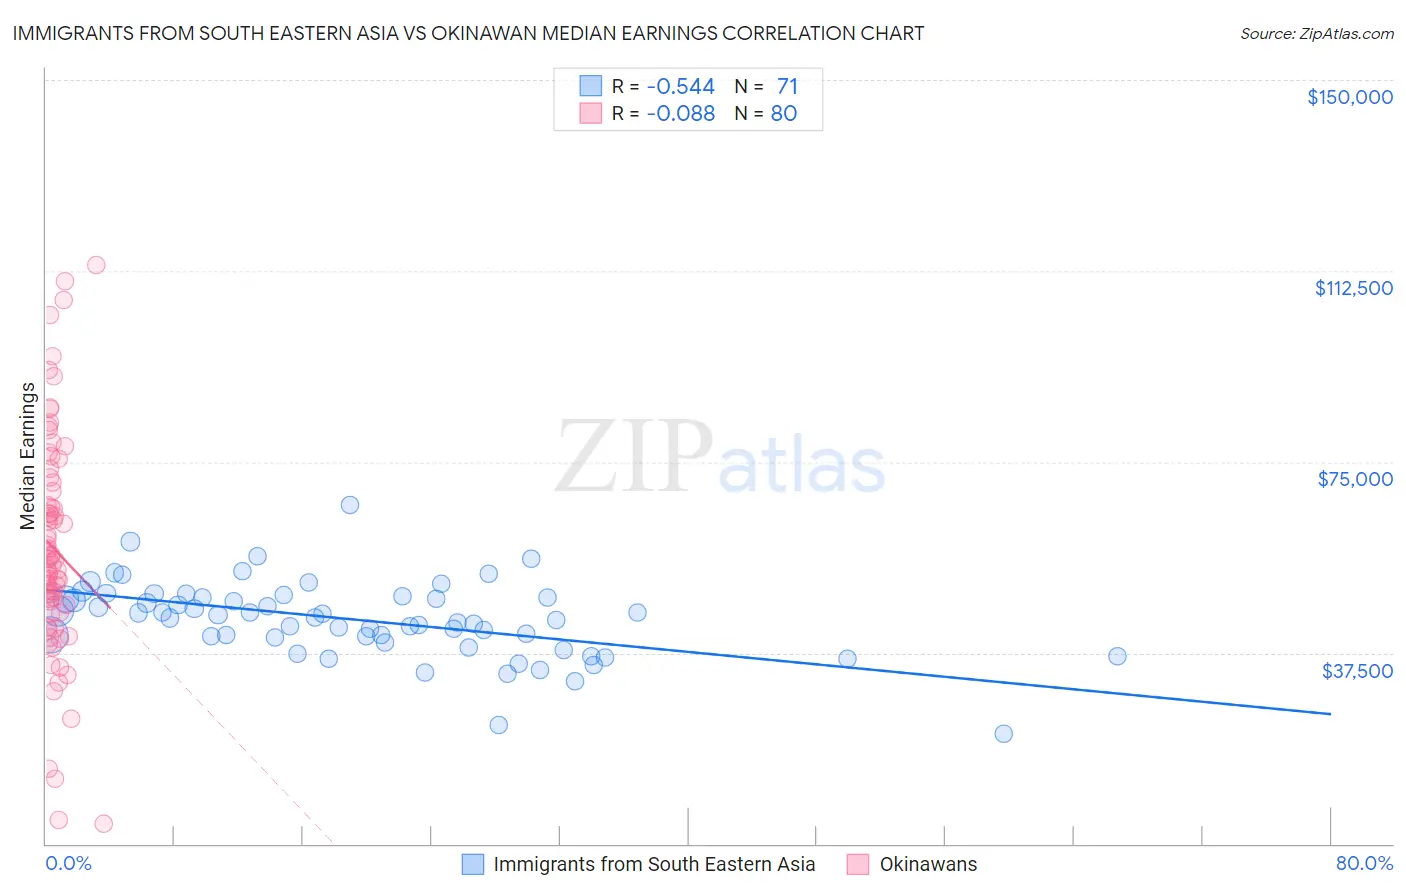
Immigrants from South Eastern Asia vs Okinawan Median Earnings Correlation Chart
The statistical analysis conducted on geographies consisting of 512,554,349 people shows a substantial negative correlation between the proportion of Immigrants from South Eastern Asia and median earnings in the United States with a correlation coefficient (R) of -0.544 and weighted average of $47,671. Similarly, the statistical analysis conducted on geographies consisting of 73,779,677 people shows a slight negative correlation between the proportion of Okinawans and median earnings in the United States with a correlation coefficient (R) of -0.088 and weighted average of $57,550, a difference of 20.7%.
Median Earnings Correlation Summary
| Measurement | Immigrants from South Eastern Asia | Okinawan |
| Minimum | $21,667 | $4,007 |
| Maximum | $66,617 | $113,728 |
| Range | $44,950 | $109,721 |
| Mean | $44,037 | $57,919 |
| Median | $44,467 | $55,875 |
| Interquartile 25% (IQ1) | $40,525 | $46,156 |
| Interquartile 75% (IQ3) | $48,439 | $70,001 |
| Interquartile Range (IQR) | $7,914 | $23,845 |
| Standard Deviation (Sample) | $7,447 | $21,992 |
| Standard Deviation (Population) | $7,395 | $21,854 |
Similar Demographics by Median Earnings
Demographics Similar to Immigrants from South Eastern Asia by Median Earnings
In terms of median earnings, the demographic groups most similar to Immigrants from South Eastern Asia are Immigrants from Eritrea ($47,657, a difference of 0.030%), Immigrants from Chile ($47,697, a difference of 0.060%), Luxembourger ($47,640, a difference of 0.060%), Immigrants from Saudi Arabia ($47,704, a difference of 0.070%), and Peruvian ($47,628, a difference of 0.090%).
| Demographics | Rating | Rank | Median Earnings |
| Taiwanese | 88.7 /100 | #140 | Excellent $47,902 |
| Immigrants | Sierra Leone | 88.3 /100 | #141 | Excellent $47,875 |
| Ugandans | 88.0 /100 | #142 | Excellent $47,854 |
| Swedes | 88.0 /100 | #143 | Excellent $47,851 |
| Hungarians | 87.1 /100 | #144 | Excellent $47,795 |
| Immigrants | Saudi Arabia | 85.6 /100 | #145 | Excellent $47,704 |
| Immigrants | Chile | 85.5 /100 | #146 | Excellent $47,697 |
| Immigrants | South Eastern Asia | 85.0 /100 | #147 | Excellent $47,671 |
| Immigrants | Eritrea | 84.8 /100 | #148 | Excellent $47,657 |
| Luxembourgers | 84.5 /100 | #149 | Excellent $47,640 |
| Peruvians | 84.2 /100 | #150 | Excellent $47,628 |
| Immigrants | Oceania | 84.1 /100 | #151 | Excellent $47,617 |
| Immigrants | Germany | 83.1 /100 | #152 | Excellent $47,566 |
| Slavs | 81.1 /100 | #153 | Excellent $47,470 |
| Immigrants | Portugal | 77.3 /100 | #154 | Good $47,304 |
Demographics Similar to Okinawans by Median Earnings
In terms of median earnings, the demographic groups most similar to Okinawans are Immigrants from Iran ($57,612, a difference of 0.11%), Immigrants from South Central Asia ($57,114, a difference of 0.76%), Immigrants from Israel ($57,034, a difference of 0.90%), Immigrants from Ireland ($56,854, a difference of 1.2%), and Iranian ($58,474, a difference of 1.6%).
| Demographics | Rating | Rank | Median Earnings |
| Immigrants | Taiwan | 100.0 /100 | #2 | Exceptional $61,151 |
| Immigrants | India | 100.0 /100 | #3 | Exceptional $60,648 |
| Immigrants | Hong Kong | 100.0 /100 | #4 | Exceptional $59,433 |
| Thais | 100.0 /100 | #5 | Exceptional $59,237 |
| Immigrants | Singapore | 100.0 /100 | #6 | Exceptional $59,038 |
| Iranians | 100.0 /100 | #7 | Exceptional $58,474 |
| Immigrants | Iran | 100.0 /100 | #8 | Exceptional $57,612 |
| Okinawans | 100.0 /100 | #9 | Exceptional $57,550 |
| Immigrants | South Central Asia | 100.0 /100 | #10 | Exceptional $57,114 |
| Immigrants | Israel | 100.0 /100 | #11 | Exceptional $57,034 |
| Immigrants | Ireland | 100.0 /100 | #12 | Exceptional $56,854 |
| Immigrants | China | 100.0 /100 | #13 | Exceptional $56,638 |
| Immigrants | Australia | 100.0 /100 | #14 | Exceptional $56,305 |
| Indians (Asian) | 100.0 /100 | #15 | Exceptional $56,253 |
| Immigrants | Eastern Asia | 100.0 /100 | #16 | Exceptional $56,183 |