Immigrants from Cambodia vs Okinawan Family Poverty
COMPARE
Immigrants from Cambodia
Okinawan
Family Poverty
Family Poverty Comparison
Immigrants from Cambodia
Okinawans
9.9%
FAMILY POVERTY
4.8/ 100
METRIC RATING
221st/ 347
METRIC RANK
7.7%
FAMILY POVERTY
98.9/ 100
METRIC RATING
45th/ 347
METRIC RANK
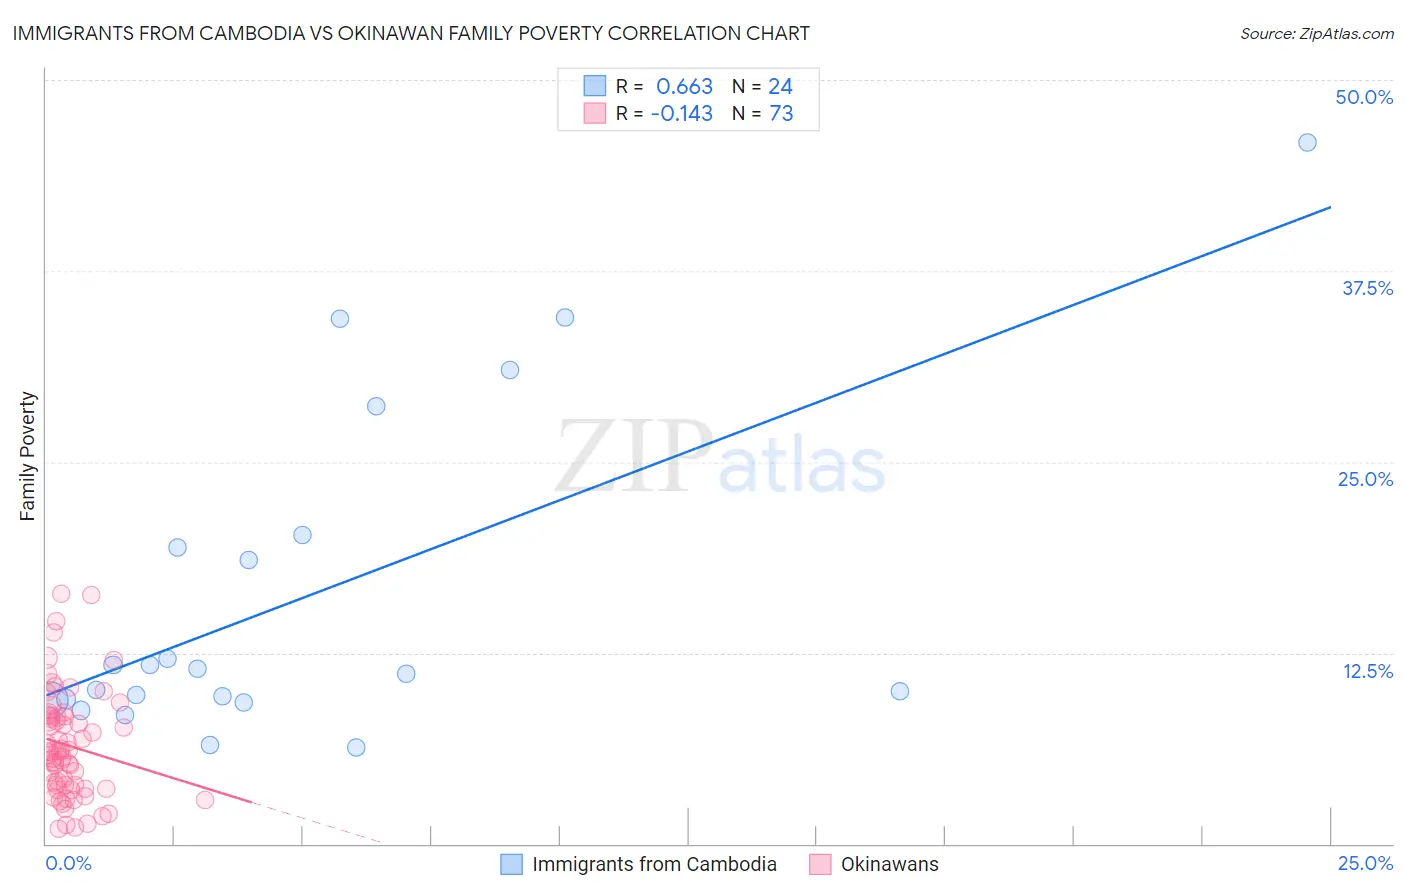
Immigrants from Cambodia vs Okinawan Family Poverty Correlation Chart
The statistical analysis conducted on geographies consisting of 204,985,132 people shows a significant positive correlation between the proportion of Immigrants from Cambodia and poverty level among families in the United States with a correlation coefficient (R) of 0.663 and weighted average of 9.9%. Similarly, the statistical analysis conducted on geographies consisting of 73,642,678 people shows a poor negative correlation between the proportion of Okinawans and poverty level among families in the United States with a correlation coefficient (R) of -0.143 and weighted average of 7.7%, a difference of 28.9%.
Family Poverty Correlation Summary
| Measurement | Immigrants from Cambodia | Okinawan |
| Minimum | 6.3% | 1.0% |
| Maximum | 45.9% | 16.4% |
| Range | 39.6% | 15.4% |
| Mean | 16.2% | 6.4% |
| Median | 11.3% | 6.0% |
| Interquartile 25% (IQ1) | 9.4% | 3.7% |
| Interquartile 75% (IQ3) | 19.8% | 8.4% |
| Interquartile Range (IQR) | 10.4% | 4.6% |
| Standard Deviation (Sample) | 10.8% | 3.5% |
| Standard Deviation (Population) | 10.5% | 3.5% |
Similar Demographics by Family Poverty
Demographics Similar to Immigrants from Cambodia by Family Poverty
In terms of family poverty, the demographic groups most similar to Immigrants from Cambodia are Japanese (9.9%, a difference of 0.030%), Bermudan (9.9%, a difference of 0.27%), Immigrants from Eritrea (9.9%, a difference of 0.33%), Immigrants from Africa (9.9%, a difference of 0.33%), and Panamanian (9.8%, a difference of 0.46%).
| Demographics | Rating | Rank | Family Poverty |
| Immigrants | Micronesia | 6.7 /100 | #214 | Tragic 9.8% |
| Immigrants | Nonimmigrants | 6.7 /100 | #215 | Tragic 9.8% |
| Moroccans | 6.5 /100 | #216 | Tragic 9.8% |
| Americans | 6.2 /100 | #217 | Tragic 9.8% |
| Panamanians | 5.6 /100 | #218 | Tragic 9.8% |
| Immigrants | Eritrea | 5.4 /100 | #219 | Tragic 9.9% |
| Bermudans | 5.3 /100 | #220 | Tragic 9.9% |
| Immigrants | Cambodia | 4.8 /100 | #221 | Tragic 9.9% |
| Japanese | 4.8 /100 | #222 | Tragic 9.9% |
| Immigrants | Africa | 4.3 /100 | #223 | Tragic 9.9% |
| Marshallese | 3.9 /100 | #224 | Tragic 9.9% |
| Immigrants | Immigrants | 3.6 /100 | #225 | Tragic 10.0% |
| Ottawa | 3.3 /100 | #226 | Tragic 10.0% |
| Immigrants | Armenia | 3.3 /100 | #227 | Tragic 10.0% |
| Sudanese | 3.1 /100 | #228 | Tragic 10.0% |
Demographics Similar to Okinawans by Family Poverty
In terms of family poverty, the demographic groups most similar to Okinawans are Tongan (7.7%, a difference of 0.010%), Immigrants from Czechoslovakia (7.7%, a difference of 0.030%), Immigrants from Sri Lanka (7.7%, a difference of 0.040%), German (7.7%, a difference of 0.12%), and Immigrants from Bolivia (7.7%, a difference of 0.23%).
| Demographics | Rating | Rank | Family Poverty |
| Bolivians | 99.3 /100 | #38 | Exceptional 7.5% |
| Carpatho Rusyns | 99.3 /100 | #39 | Exceptional 7.5% |
| Slovenes | 99.3 /100 | #40 | Exceptional 7.5% |
| Immigrants | Australia | 99.2 /100 | #41 | Exceptional 7.6% |
| Scandinavians | 99.1 /100 | #42 | Exceptional 7.6% |
| Immigrants | Austria | 99.1 /100 | #43 | Exceptional 7.6% |
| Germans | 99.0 /100 | #44 | Exceptional 7.7% |
| Okinawans | 98.9 /100 | #45 | Exceptional 7.7% |
| Tongans | 98.9 /100 | #46 | Exceptional 7.7% |
| Immigrants | Czechoslovakia | 98.9 /100 | #47 | Exceptional 7.7% |
| Immigrants | Sri Lanka | 98.9 /100 | #48 | Exceptional 7.7% |
| Immigrants | Bolivia | 98.9 /100 | #49 | Exceptional 7.7% |
| Immigrants | North Macedonia | 98.9 /100 | #50 | Exceptional 7.7% |
| Immigrants | Moldova | 98.8 /100 | #51 | Exceptional 7.7% |
| Indians (Asian) | 98.8 /100 | #52 | Exceptional 7.7% |