French vs Immigrants from Switzerland Median Male Earnings
COMPARE
French
Immigrants from Switzerland
Median Male Earnings
Median Male Earnings Comparison
French
Immigrants from Switzerland
$55,350
MEDIAN MALE EARNINGS
69.9/ 100
METRIC RATING
162nd/ 347
METRIC RANK
$63,944
MEDIAN MALE EARNINGS
100.0/ 100
METRIC RATING
27th/ 347
METRIC RANK
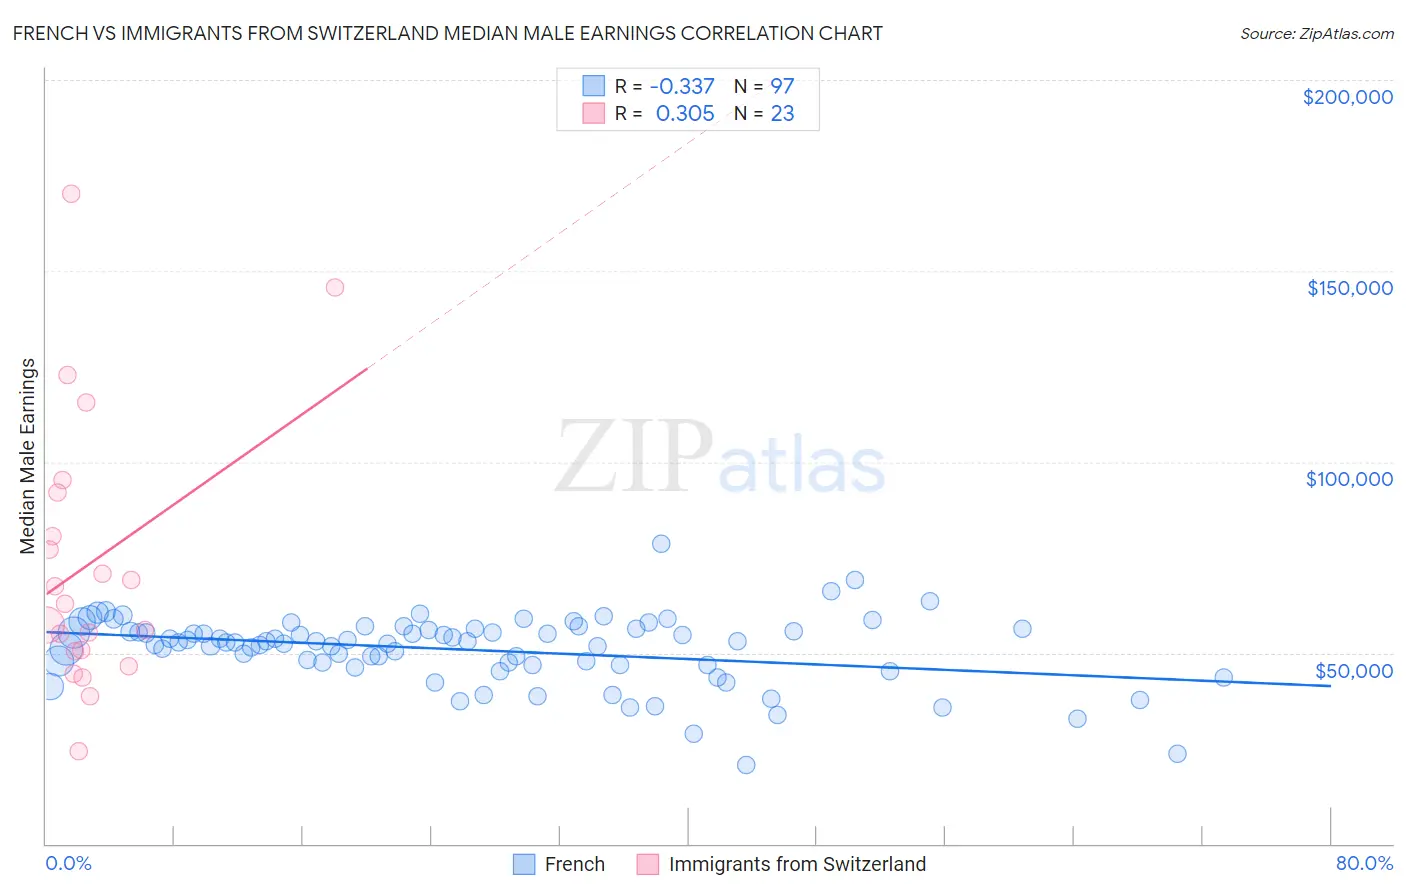
French vs Immigrants from Switzerland Median Male Earnings Correlation Chart
The statistical analysis conducted on geographies consisting of 571,095,815 people shows a mild negative correlation between the proportion of French and median male earnings in the United States with a correlation coefficient (R) of -0.337 and weighted average of $55,350. Similarly, the statistical analysis conducted on geographies consisting of 148,046,758 people shows a mild positive correlation between the proportion of Immigrants from Switzerland and median male earnings in the United States with a correlation coefficient (R) of 0.305 and weighted average of $63,944, a difference of 15.5%.
Median Male Earnings Correlation Summary
| Measurement | French | Immigrants from Switzerland |
| Minimum | $20,556 | $24,152 |
| Maximum | $78,663 | $170,239 |
| Range | $58,107 | $146,087 |
| Mean | $50,816 | $73,519 |
| Median | $52,806 | $62,840 |
| Interquartile 25% (IQ1) | $46,933 | $50,348 |
| Interquartile 75% (IQ3) | $56,096 | $91,948 |
| Interquartile Range (IQR) | $9,162 | $41,600 |
| Standard Deviation (Sample) | $9,122 | $35,831 |
| Standard Deviation (Population) | $9,075 | $35,043 |
Similar Demographics by Median Male Earnings
Demographics Similar to French by Median Male Earnings
In terms of median male earnings, the demographic groups most similar to French are Belgian ($55,361, a difference of 0.020%), Basque ($55,370, a difference of 0.040%), Alsatian ($55,380, a difference of 0.050%), Czechoslovakian ($55,382, a difference of 0.060%), and Ugandan ($55,290, a difference of 0.11%).
| Demographics | Rating | Rank | Median Male Earnings |
| Scandinavians | 73.4 /100 | #155 | Good $55,527 |
| Immigrants | Ethiopia | 71.6 /100 | #156 | Good $55,434 |
| Icelanders | 71.2 /100 | #157 | Good $55,415 |
| Czechoslovakians | 70.5 /100 | #158 | Good $55,382 |
| Alsatians | 70.5 /100 | #159 | Good $55,380 |
| Basques | 70.3 /100 | #160 | Good $55,370 |
| Belgians | 70.1 /100 | #161 | Good $55,361 |
| French | 69.9 /100 | #162 | Good $55,350 |
| Ugandans | 68.6 /100 | #163 | Good $55,290 |
| Immigrants | South Eastern Asia | 67.6 /100 | #164 | Good $55,241 |
| Immigrants | Portugal | 66.3 /100 | #165 | Good $55,182 |
| Germans | 61.6 /100 | #166 | Good $54,974 |
| Immigrants | Fiji | 61.2 /100 | #167 | Good $54,958 |
| Immigrants | Vietnam | 60.2 /100 | #168 | Good $54,913 |
| French Canadians | 55.6 /100 | #169 | Average $54,722 |
Demographics Similar to Immigrants from Switzerland by Median Male Earnings
In terms of median male earnings, the demographic groups most similar to Immigrants from Switzerland are Russian ($63,939, a difference of 0.010%), Asian ($63,827, a difference of 0.18%), Immigrants from France ($63,715, a difference of 0.36%), Turkish ($64,253, a difference of 0.48%), and Latvian ($63,498, a difference of 0.70%).
| Demographics | Rating | Rank | Median Male Earnings |
| Immigrants | Japan | 100.0 /100 | #20 | Exceptional $65,518 |
| Immigrants | Sweden | 100.0 /100 | #21 | Exceptional $65,406 |
| Burmese | 100.0 /100 | #22 | Exceptional $65,236 |
| Immigrants | Korea | 100.0 /100 | #23 | Exceptional $65,079 |
| Immigrants | Northern Europe | 100.0 /100 | #24 | Exceptional $64,987 |
| Immigrants | Denmark | 100.0 /100 | #25 | Exceptional $64,625 |
| Turks | 100.0 /100 | #26 | Exceptional $64,253 |
| Immigrants | Switzerland | 100.0 /100 | #27 | Exceptional $63,944 |
| Russians | 100.0 /100 | #28 | Exceptional $63,939 |
| Asians | 100.0 /100 | #29 | Exceptional $63,827 |
| Immigrants | France | 100.0 /100 | #30 | Exceptional $63,715 |
| Latvians | 100.0 /100 | #31 | Exceptional $63,498 |
| Soviet Union | 100.0 /100 | #32 | Exceptional $63,382 |
| Immigrants | Lithuania | 100.0 /100 | #33 | Exceptional $63,346 |
| Immigrants | Russia | 100.0 /100 | #34 | Exceptional $63,326 |