Immigrants from Cabo Verde vs Tongan Householder Income Ages 25 - 44 years
COMPARE
Immigrants from Cabo Verde
Tongan
Householder Income Ages 25 - 44 years
Householder Income Ages 25 - 44 years Comparison
Immigrants from Cabo Verde
Tongans
$84,304
HOUSEHOLDER INCOME AGES 25 - 44 YEARS
0.3/ 100
METRIC RATING
266th/ 347
METRIC RANK
$99,604
HOUSEHOLDER INCOME AGES 25 - 44 YEARS
94.2/ 100
METRIC RATING
113th/ 347
METRIC RANK
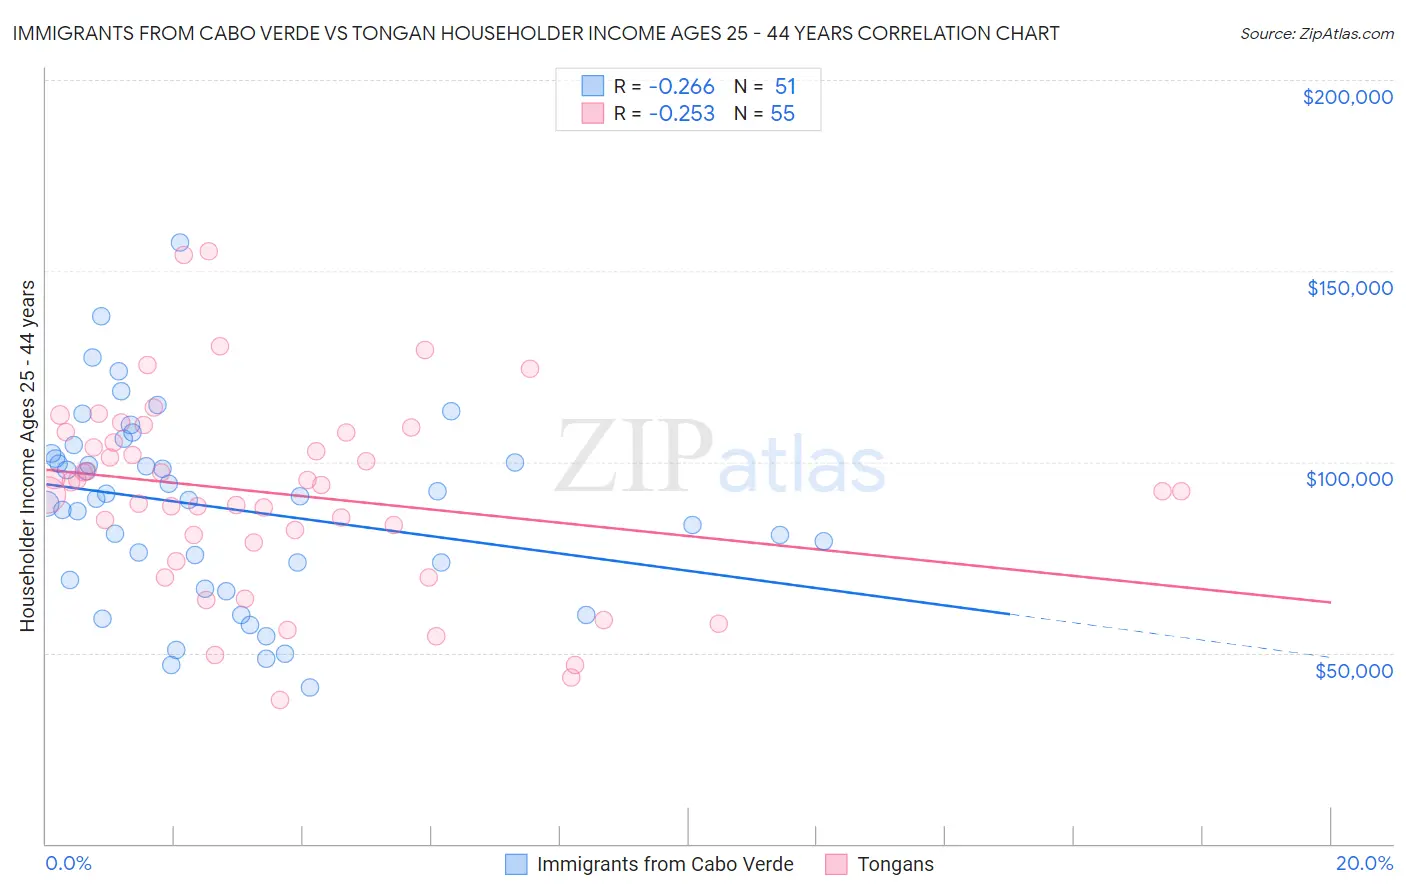
Immigrants from Cabo Verde vs Tongan Householder Income Ages 25 - 44 years Correlation Chart
The statistical analysis conducted on geographies consisting of 38,130,203 people shows a weak negative correlation between the proportion of Immigrants from Cabo Verde and household income with householder between the ages 25 and 44 in the United States with a correlation coefficient (R) of -0.266 and weighted average of $84,304. Similarly, the statistical analysis conducted on geographies consisting of 102,745,884 people shows a weak negative correlation between the proportion of Tongans and household income with householder between the ages 25 and 44 in the United States with a correlation coefficient (R) of -0.253 and weighted average of $99,604, a difference of 18.1%.
Householder Income Ages 25 - 44 years Correlation Summary
| Measurement | Immigrants from Cabo Verde | Tongan |
| Minimum | $41,033 | $37,778 |
| Maximum | $157,447 | $155,050 |
| Range | $116,414 | $117,272 |
| Mean | $88,098 | $91,685 |
| Median | $90,262 | $93,885 |
| Interquartile 25% (IQ1) | $68,956 | $78,849 |
| Interquartile 75% (IQ3) | $102,154 | $107,550 |
| Interquartile Range (IQR) | $33,198 | $28,701 |
| Standard Deviation (Sample) | $24,804 | $25,126 |
| Standard Deviation (Population) | $24,559 | $24,896 |
Similar Demographics by Householder Income Ages 25 - 44 years
Demographics Similar to Immigrants from Cabo Verde by Householder Income Ages 25 - 44 years
In terms of householder income ages 25 - 44 years, the demographic groups most similar to Immigrants from Cabo Verde are Hmong ($84,258, a difference of 0.050%), Subsaharan African ($84,235, a difference of 0.080%), Sudanese ($84,401, a difference of 0.12%), Osage ($84,461, a difference of 0.19%), and Spanish American Indian ($84,085, a difference of 0.26%).
| Demographics | Rating | Rank | Householder Income Ages 25 - 44 years |
| Immigrants | Senegal | 0.5 /100 | #259 | Tragic $84,848 |
| Americans | 0.4 /100 | #260 | Tragic $84,791 |
| Inupiat | 0.4 /100 | #261 | Tragic $84,619 |
| Cree | 0.4 /100 | #262 | Tragic $84,574 |
| Belizeans | 0.4 /100 | #263 | Tragic $84,534 |
| Osage | 0.4 /100 | #264 | Tragic $84,461 |
| Sudanese | 0.4 /100 | #265 | Tragic $84,401 |
| Immigrants | Cabo Verde | 0.3 /100 | #266 | Tragic $84,304 |
| Hmong | 0.3 /100 | #267 | Tragic $84,258 |
| Sub-Saharan Africans | 0.3 /100 | #268 | Tragic $84,235 |
| Spanish American Indians | 0.3 /100 | #269 | Tragic $84,085 |
| Jamaicans | 0.3 /100 | #270 | Tragic $83,933 |
| Somalis | 0.2 /100 | #271 | Tragic $83,752 |
| Spanish Americans | 0.2 /100 | #272 | Tragic $83,722 |
| Iroquois | 0.2 /100 | #273 | Tragic $83,682 |
Demographics Similar to Tongans by Householder Income Ages 25 - 44 years
In terms of householder income ages 25 - 44 years, the demographic groups most similar to Tongans are Polish ($99,685, a difference of 0.080%), Immigrants from Western Asia ($99,516, a difference of 0.090%), Carpatho Rusyn ($99,449, a difference of 0.16%), Portuguese ($99,429, a difference of 0.18%), and Chilean ($99,900, a difference of 0.30%).
| Demographics | Rating | Rank | Householder Income Ages 25 - 44 years |
| Immigrants | Brazil | 96.5 /100 | #106 | Exceptional $100,534 |
| Northern Europeans | 96.3 /100 | #107 | Exceptional $100,457 |
| Immigrants | South Eastern Asia | 96.0 /100 | #108 | Exceptional $100,283 |
| Immigrants | North Macedonia | 95.6 /100 | #109 | Exceptional $100,101 |
| Immigrants | Afghanistan | 95.3 /100 | #110 | Exceptional $99,977 |
| Chileans | 95.1 /100 | #111 | Exceptional $99,900 |
| Poles | 94.5 /100 | #112 | Exceptional $99,685 |
| Tongans | 94.2 /100 | #113 | Exceptional $99,604 |
| Immigrants | Western Asia | 94.0 /100 | #114 | Exceptional $99,516 |
| Carpatho Rusyns | 93.7 /100 | #115 | Exceptional $99,449 |
| Portuguese | 93.7 /100 | #116 | Exceptional $99,429 |
| Immigrants | Northern Africa | 93.0 /100 | #117 | Exceptional $99,232 |
| Syrians | 92.9 /100 | #118 | Exceptional $99,215 |
| Jordanians | 92.8 /100 | #119 | Exceptional $99,186 |
| Swedes | 92.7 /100 | #120 | Exceptional $99,136 |