Immigrants from Cabo Verde vs Tongan In Labor Force | Age 25-29
COMPARE
Immigrants from Cabo Verde
Tongan
In Labor Force | Age 25-29
In Labor Force | Age 25-29 Comparison
Immigrants from Cabo Verde
Tongans
86.2%
IN LABOR FORCE | AGE 25-29
100.0/ 100
METRIC RATING
8th/ 347
METRIC RANK
84.7%
IN LABOR FORCE | AGE 25-29
52.4/ 100
METRIC RATING
170th/ 347
METRIC RANK
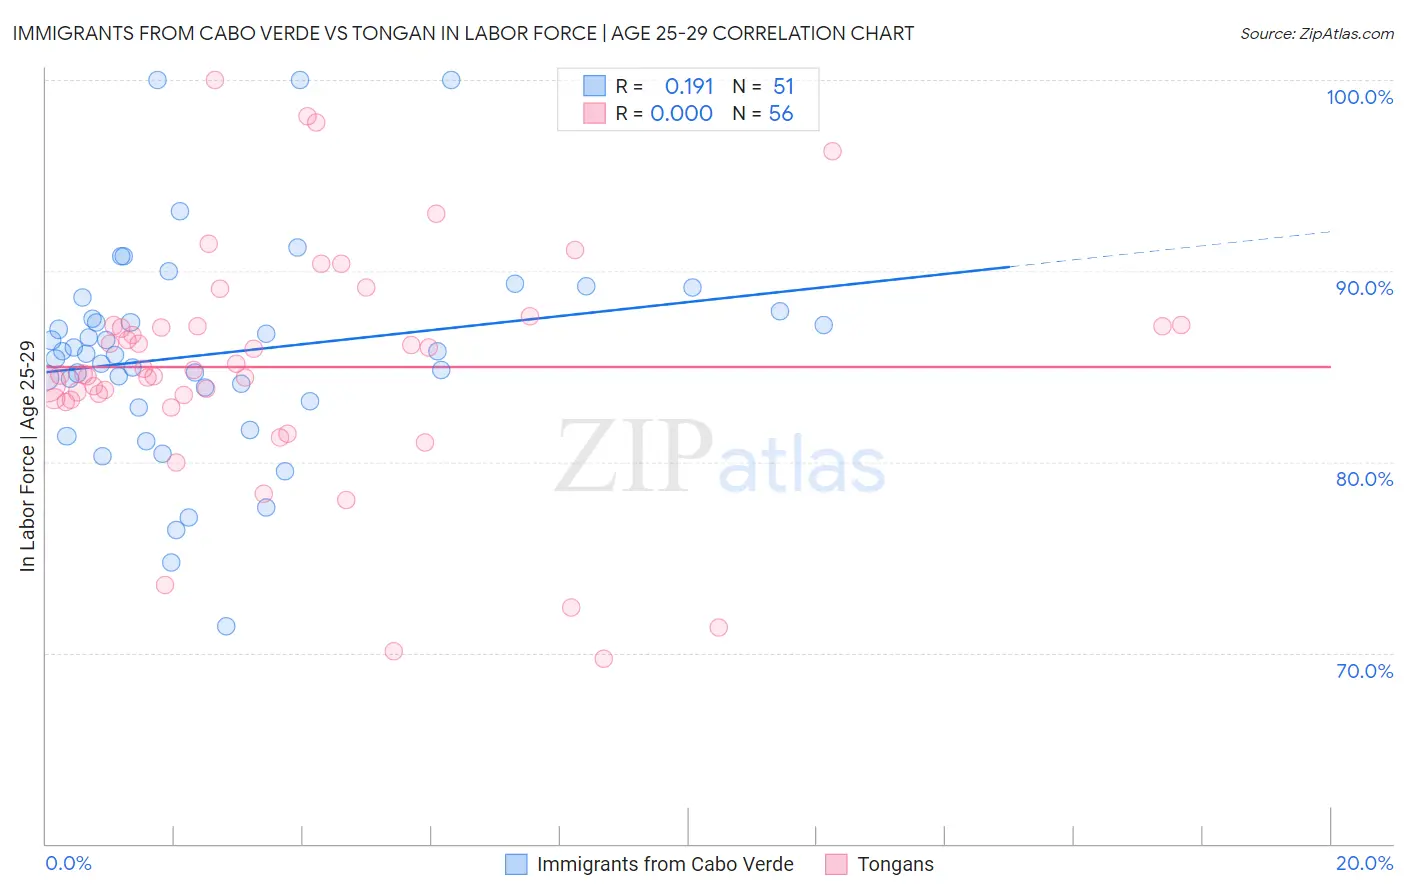
Immigrants from Cabo Verde vs Tongan In Labor Force | Age 25-29 Correlation Chart
The statistical analysis conducted on geographies consisting of 38,156,394 people shows a poor positive correlation between the proportion of Immigrants from Cabo Verde and labor force participation rate among population between the ages 25 and 29 in the United States with a correlation coefficient (R) of 0.191 and weighted average of 86.2%. Similarly, the statistical analysis conducted on geographies consisting of 102,903,865 people shows no correlation between the proportion of Tongans and labor force participation rate among population between the ages 25 and 29 in the United States with a correlation coefficient (R) of 0.000 and weighted average of 84.7%, a difference of 1.8%.
In Labor Force | Age 25-29 Correlation Summary
| Measurement | Immigrants from Cabo Verde | Tongan |
| Minimum | 71.4% | 69.7% |
| Maximum | 100.0% | 100.0% |
| Range | 28.6% | 30.3% |
| Mean | 85.7% | 85.0% |
| Median | 85.7% | 84.7% |
| Interquartile 25% (IQ1) | 83.2% | 83.3% |
| Interquartile 75% (IQ3) | 87.9% | 87.1% |
| Interquartile Range (IQR) | 4.7% | 3.8% |
| Standard Deviation (Sample) | 5.6% | 6.2% |
| Standard Deviation (Population) | 5.5% | 6.1% |
Similar Demographics by In Labor Force | Age 25-29
Demographics Similar to Immigrants from Cabo Verde by In Labor Force | Age 25-29
In terms of in labor force | age 25-29, the demographic groups most similar to Immigrants from Cabo Verde are Ethiopian (86.2%, a difference of 0.030%), Immigrants from Bosnia and Herzegovina (86.3%, a difference of 0.070%), Liberian (86.1%, a difference of 0.080%), Immigrants from Ethiopia (86.1%, a difference of 0.080%), and Immigrants from Lithuania (86.1%, a difference of 0.10%).
| Demographics | Rating | Rank | In Labor Force | Age 25-29 |
| Tsimshian | 100.0 /100 | #1 | Exceptional 88.7% |
| Immigrants | Somalia | 100.0 /100 | #2 | Exceptional 87.1% |
| Somalis | 100.0 /100 | #3 | Exceptional 87.1% |
| Carpatho Rusyns | 100.0 /100 | #4 | Exceptional 87.0% |
| Luxembourgers | 100.0 /100 | #5 | Exceptional 86.9% |
| Slovenes | 100.0 /100 | #6 | Exceptional 86.4% |
| Immigrants | Bosnia and Herzegovina | 100.0 /100 | #7 | Exceptional 86.3% |
| Immigrants | Cabo Verde | 100.0 /100 | #8 | Exceptional 86.2% |
| Ethiopians | 100.0 /100 | #9 | Exceptional 86.2% |
| Liberians | 100.0 /100 | #10 | Exceptional 86.1% |
| Immigrants | Ethiopia | 100.0 /100 | #11 | Exceptional 86.1% |
| Immigrants | Lithuania | 100.0 /100 | #12 | Exceptional 86.1% |
| Norwegians | 100.0 /100 | #13 | Exceptional 86.1% |
| Latvians | 100.0 /100 | #14 | Exceptional 86.1% |
| Bolivians | 100.0 /100 | #15 | Exceptional 86.1% |
Demographics Similar to Tongans by In Labor Force | Age 25-29
In terms of in labor force | age 25-29, the demographic groups most similar to Tongans are Celtic (84.7%, a difference of 0.0%), Immigrants from Vietnam (84.7%, a difference of 0.010%), Immigrants from Western Europe (84.7%, a difference of 0.010%), South American (84.7%, a difference of 0.020%), and Assyrian/Chaldean/Syriac (84.7%, a difference of 0.020%).
| Demographics | Rating | Rank | In Labor Force | Age 25-29 |
| Argentineans | 57.9 /100 | #163 | Average 84.7% |
| Ghanaians | 57.6 /100 | #164 | Average 84.7% |
| Immigrants | Burma/Myanmar | 57.4 /100 | #165 | Average 84.7% |
| Immigrants | Spain | 56.9 /100 | #166 | Average 84.7% |
| Indonesians | 56.5 /100 | #167 | Average 84.7% |
| South Americans | 54.9 /100 | #168 | Average 84.7% |
| Celtics | 52.5 /100 | #169 | Average 84.7% |
| Tongans | 52.4 /100 | #170 | Average 84.7% |
| Immigrants | Vietnam | 50.5 /100 | #171 | Average 84.7% |
| Immigrants | Western Europe | 50.4 /100 | #172 | Average 84.7% |
| Assyrians/Chaldeans/Syriacs | 50.2 /100 | #173 | Average 84.7% |
| Palestinians | 50.0 /100 | #174 | Average 84.7% |
| Hungarians | 47.8 /100 | #175 | Average 84.6% |
| Malaysians | 46.8 /100 | #176 | Average 84.6% |
| Immigrants | China | 45.7 /100 | #177 | Average 84.6% |