Black/African American vs Tongan Householder Income Ages 25 - 44 years
COMPARE
Black/African American
Tongan
Householder Income Ages 25 - 44 years
Householder Income Ages 25 - 44 years Comparison
Blacks/African Americans
Tongans
$73,370
HOUSEHOLDER INCOME AGES 25 - 44 YEARS
0.0/ 100
METRIC RATING
337th/ 347
METRIC RANK
$99,604
HOUSEHOLDER INCOME AGES 25 - 44 YEARS
94.2/ 100
METRIC RATING
113th/ 347
METRIC RANK
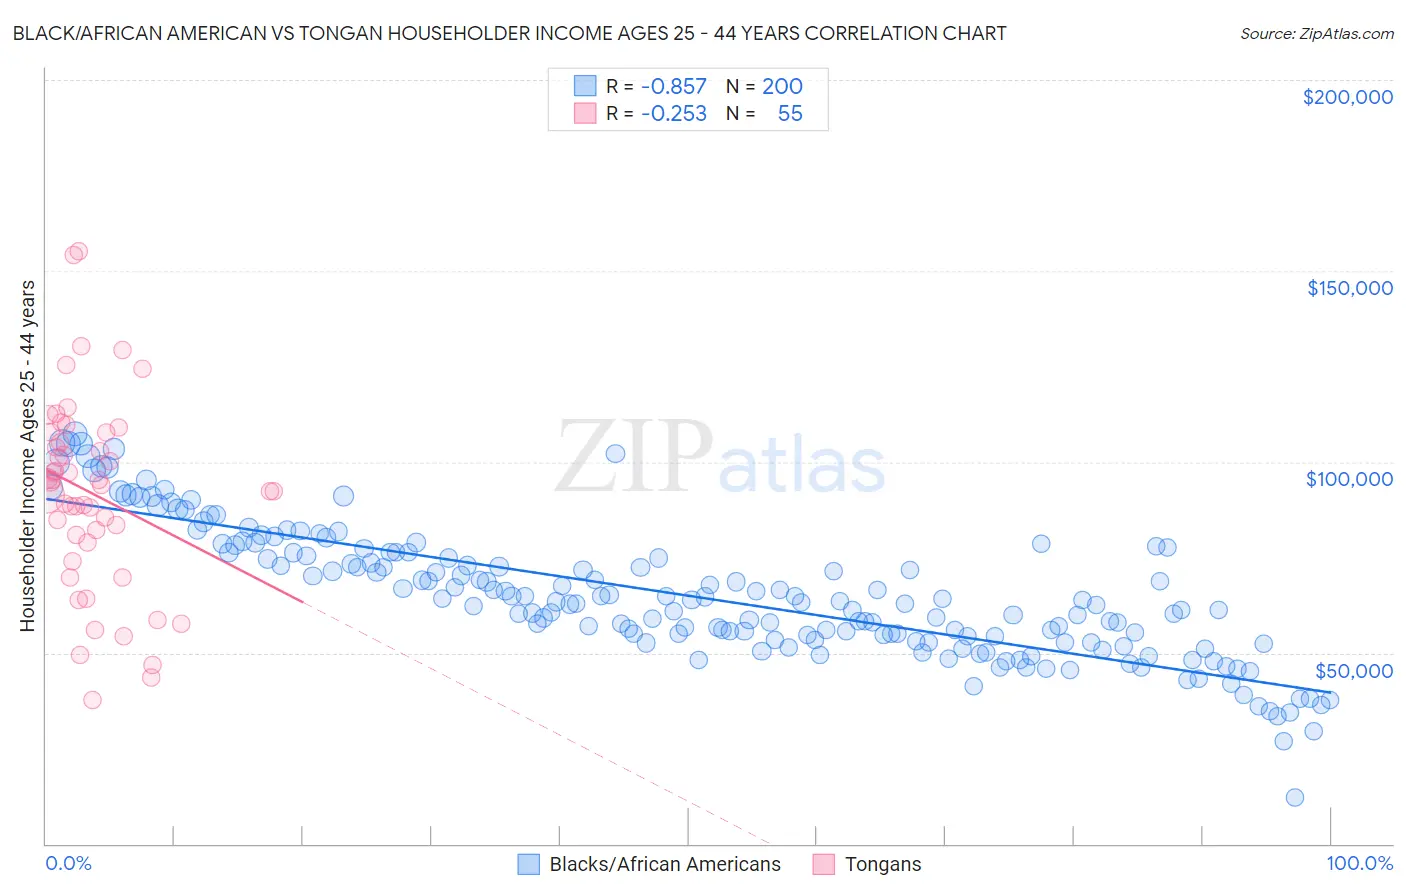
Black/African American vs Tongan Householder Income Ages 25 - 44 years Correlation Chart
The statistical analysis conducted on geographies consisting of 560,674,363 people shows a very strong negative correlation between the proportion of Blacks/African Americans and household income with householder between the ages 25 and 44 in the United States with a correlation coefficient (R) of -0.857 and weighted average of $73,370. Similarly, the statistical analysis conducted on geographies consisting of 102,745,884 people shows a weak negative correlation between the proportion of Tongans and household income with householder between the ages 25 and 44 in the United States with a correlation coefficient (R) of -0.253 and weighted average of $99,604, a difference of 35.8%.
Householder Income Ages 25 - 44 years Correlation Summary
| Measurement | Black/African American | Tongan |
| Minimum | $12,048 | $37,778 |
| Maximum | $107,395 | $155,050 |
| Range | $95,347 | $117,272 |
| Mean | $64,936 | $91,685 |
| Median | $63,200 | $93,885 |
| Interquartile 25% (IQ1) | $53,277 | $78,849 |
| Interquartile 75% (IQ3) | $76,198 | $107,550 |
| Interquartile Range (IQR) | $22,921 | $28,701 |
| Standard Deviation (Sample) | $17,118 | $25,126 |
| Standard Deviation (Population) | $17,075 | $24,896 |
Similar Demographics by Householder Income Ages 25 - 44 years
Demographics Similar to Blacks/African Americans by Householder Income Ages 25 - 44 years
In terms of householder income ages 25 - 44 years, the demographic groups most similar to Blacks/African Americans are Yup'ik ($73,688, a difference of 0.43%), Immigrants from Yemen ($73,043, a difference of 0.45%), Yuman ($72,956, a difference of 0.57%), Immigrants from Congo ($72,178, a difference of 1.7%), and Kiowa ($74,776, a difference of 1.9%).
| Demographics | Rating | Rank | Householder Income Ages 25 - 44 years |
| Yakama | 0.0 /100 | #330 | Tragic $76,226 |
| Natives/Alaskans | 0.0 /100 | #331 | Tragic $75,647 |
| Bahamians | 0.0 /100 | #332 | Tragic $75,395 |
| Hopi | 0.0 /100 | #333 | Tragic $75,002 |
| Creek | 0.0 /100 | #334 | Tragic $74,847 |
| Kiowa | 0.0 /100 | #335 | Tragic $74,776 |
| Yup'ik | 0.0 /100 | #336 | Tragic $73,688 |
| Blacks/African Americans | 0.0 /100 | #337 | Tragic $73,370 |
| Immigrants | Yemen | 0.0 /100 | #338 | Tragic $73,043 |
| Yuman | 0.0 /100 | #339 | Tragic $72,956 |
| Immigrants | Congo | 0.0 /100 | #340 | Tragic $72,178 |
| Arapaho | 0.0 /100 | #341 | Tragic $71,697 |
| Crow | 0.0 /100 | #342 | Tragic $71,337 |
| Tohono O'odham | 0.0 /100 | #343 | Tragic $69,068 |
| Pueblo | 0.0 /100 | #344 | Tragic $68,910 |
Demographics Similar to Tongans by Householder Income Ages 25 - 44 years
In terms of householder income ages 25 - 44 years, the demographic groups most similar to Tongans are Polish ($99,685, a difference of 0.080%), Immigrants from Western Asia ($99,516, a difference of 0.090%), Carpatho Rusyn ($99,449, a difference of 0.16%), Portuguese ($99,429, a difference of 0.18%), and Chilean ($99,900, a difference of 0.30%).
| Demographics | Rating | Rank | Householder Income Ages 25 - 44 years |
| Immigrants | Brazil | 96.5 /100 | #106 | Exceptional $100,534 |
| Northern Europeans | 96.3 /100 | #107 | Exceptional $100,457 |
| Immigrants | South Eastern Asia | 96.0 /100 | #108 | Exceptional $100,283 |
| Immigrants | North Macedonia | 95.6 /100 | #109 | Exceptional $100,101 |
| Immigrants | Afghanistan | 95.3 /100 | #110 | Exceptional $99,977 |
| Chileans | 95.1 /100 | #111 | Exceptional $99,900 |
| Poles | 94.5 /100 | #112 | Exceptional $99,685 |
| Tongans | 94.2 /100 | #113 | Exceptional $99,604 |
| Immigrants | Western Asia | 94.0 /100 | #114 | Exceptional $99,516 |
| Carpatho Rusyns | 93.7 /100 | #115 | Exceptional $99,449 |
| Portuguese | 93.7 /100 | #116 | Exceptional $99,429 |
| Immigrants | Northern Africa | 93.0 /100 | #117 | Exceptional $99,232 |
| Syrians | 92.9 /100 | #118 | Exceptional $99,215 |
| Jordanians | 92.8 /100 | #119 | Exceptional $99,186 |
| Swedes | 92.7 /100 | #120 | Exceptional $99,136 |