Immigrants from Cabo Verde vs Immigrants from Brazil Householder Income Ages 25 - 44 years
COMPARE
Immigrants from Cabo Verde
Immigrants from Brazil
Householder Income Ages 25 - 44 years
Householder Income Ages 25 - 44 years Comparison
Immigrants from Cabo Verde
Immigrants from Brazil
$84,304
HOUSEHOLDER INCOME AGES 25 - 44 YEARS
0.3/ 100
METRIC RATING
266th/ 347
METRIC RANK
$100,534
HOUSEHOLDER INCOME AGES 25 - 44 YEARS
96.5/ 100
METRIC RATING
106th/ 347
METRIC RANK
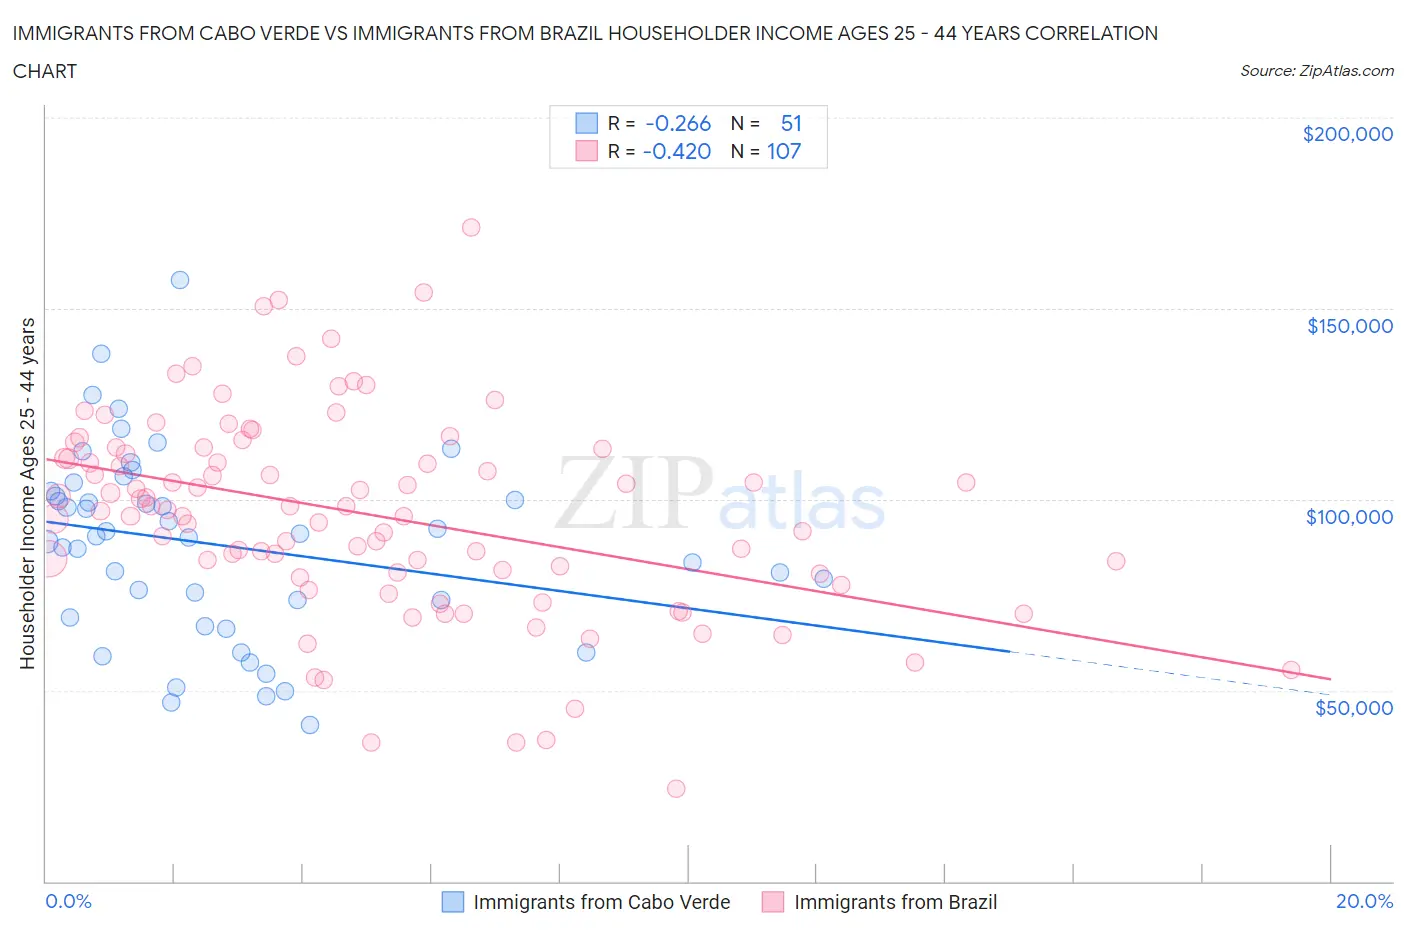
Immigrants from Cabo Verde vs Immigrants from Brazil Householder Income Ages 25 - 44 years Correlation Chart
The statistical analysis conducted on geographies consisting of 38,130,203 people shows a weak negative correlation between the proportion of Immigrants from Cabo Verde and household income with householder between the ages 25 and 44 in the United States with a correlation coefficient (R) of -0.266 and weighted average of $84,304. Similarly, the statistical analysis conducted on geographies consisting of 342,484,702 people shows a moderate negative correlation between the proportion of Immigrants from Brazil and household income with householder between the ages 25 and 44 in the United States with a correlation coefficient (R) of -0.420 and weighted average of $100,534, a difference of 19.3%.
Householder Income Ages 25 - 44 years Correlation Summary
| Measurement | Immigrants from Cabo Verde | Immigrants from Brazil |
| Minimum | $41,033 | $24,240 |
| Maximum | $157,447 | $171,042 |
| Range | $116,414 | $146,802 |
| Mean | $88,098 | $95,965 |
| Median | $90,262 | $97,321 |
| Interquartile 25% (IQ1) | $68,956 | $80,473 |
| Interquartile 75% (IQ3) | $102,154 | $113,214 |
| Interquartile Range (IQR) | $33,198 | $32,741 |
| Standard Deviation (Sample) | $24,804 | $26,677 |
| Standard Deviation (Population) | $24,559 | $26,552 |
Similar Demographics by Householder Income Ages 25 - 44 years
Demographics Similar to Immigrants from Cabo Verde by Householder Income Ages 25 - 44 years
In terms of householder income ages 25 - 44 years, the demographic groups most similar to Immigrants from Cabo Verde are Hmong ($84,258, a difference of 0.050%), Subsaharan African ($84,235, a difference of 0.080%), Sudanese ($84,401, a difference of 0.12%), Osage ($84,461, a difference of 0.19%), and Spanish American Indian ($84,085, a difference of 0.26%).
| Demographics | Rating | Rank | Householder Income Ages 25 - 44 years |
| Immigrants | Senegal | 0.5 /100 | #259 | Tragic $84,848 |
| Americans | 0.4 /100 | #260 | Tragic $84,791 |
| Inupiat | 0.4 /100 | #261 | Tragic $84,619 |
| Cree | 0.4 /100 | #262 | Tragic $84,574 |
| Belizeans | 0.4 /100 | #263 | Tragic $84,534 |
| Osage | 0.4 /100 | #264 | Tragic $84,461 |
| Sudanese | 0.4 /100 | #265 | Tragic $84,401 |
| Immigrants | Cabo Verde | 0.3 /100 | #266 | Tragic $84,304 |
| Hmong | 0.3 /100 | #267 | Tragic $84,258 |
| Sub-Saharan Africans | 0.3 /100 | #268 | Tragic $84,235 |
| Spanish American Indians | 0.3 /100 | #269 | Tragic $84,085 |
| Jamaicans | 0.3 /100 | #270 | Tragic $83,933 |
| Somalis | 0.2 /100 | #271 | Tragic $83,752 |
| Spanish Americans | 0.2 /100 | #272 | Tragic $83,722 |
| Iroquois | 0.2 /100 | #273 | Tragic $83,682 |
Demographics Similar to Immigrants from Brazil by Householder Income Ages 25 - 44 years
In terms of householder income ages 25 - 44 years, the demographic groups most similar to Immigrants from Brazil are Immigrants from Vietnam ($100,535, a difference of 0.0%), Northern European ($100,457, a difference of 0.080%), Immigrants from South Eastern Asia ($100,283, a difference of 0.25%), Immigrants from North Macedonia ($100,101, a difference of 0.43%), and Immigrants from Poland ($101,065, a difference of 0.53%).
| Demographics | Rating | Rank | Householder Income Ages 25 - 44 years |
| Taiwanese | 97.9 /100 | #99 | Exceptional $101,492 |
| Immigrants | Argentina | 97.8 /100 | #100 | Exceptional $101,415 |
| Albanians | 97.8 /100 | #101 | Exceptional $101,367 |
| Immigrants | Lebanon | 97.4 /100 | #102 | Exceptional $101,124 |
| Immigrants | Moldova | 97.4 /100 | #103 | Exceptional $101,091 |
| Immigrants | Poland | 97.4 /100 | #104 | Exceptional $101,065 |
| Immigrants | Vietnam | 96.5 /100 | #105 | Exceptional $100,535 |
| Immigrants | Brazil | 96.5 /100 | #106 | Exceptional $100,534 |
| Northern Europeans | 96.3 /100 | #107 | Exceptional $100,457 |
| Immigrants | South Eastern Asia | 96.0 /100 | #108 | Exceptional $100,283 |
| Immigrants | North Macedonia | 95.6 /100 | #109 | Exceptional $100,101 |
| Immigrants | Afghanistan | 95.3 /100 | #110 | Exceptional $99,977 |
| Chileans | 95.1 /100 | #111 | Exceptional $99,900 |
| Poles | 94.5 /100 | #112 | Exceptional $99,685 |
| Tongans | 94.2 /100 | #113 | Exceptional $99,604 |