Immigrants from Cabo Verde vs Subsaharan African Householder Income Ages 25 - 44 years
COMPARE
Immigrants from Cabo Verde
Subsaharan African
Householder Income Ages 25 - 44 years
Householder Income Ages 25 - 44 years Comparison
Immigrants from Cabo Verde
Sub-Saharan Africans
$84,304
HOUSEHOLDER INCOME AGES 25 - 44 YEARS
0.3/ 100
METRIC RATING
266th/ 347
METRIC RANK
$84,235
HOUSEHOLDER INCOME AGES 25 - 44 YEARS
0.3/ 100
METRIC RATING
268th/ 347
METRIC RANK
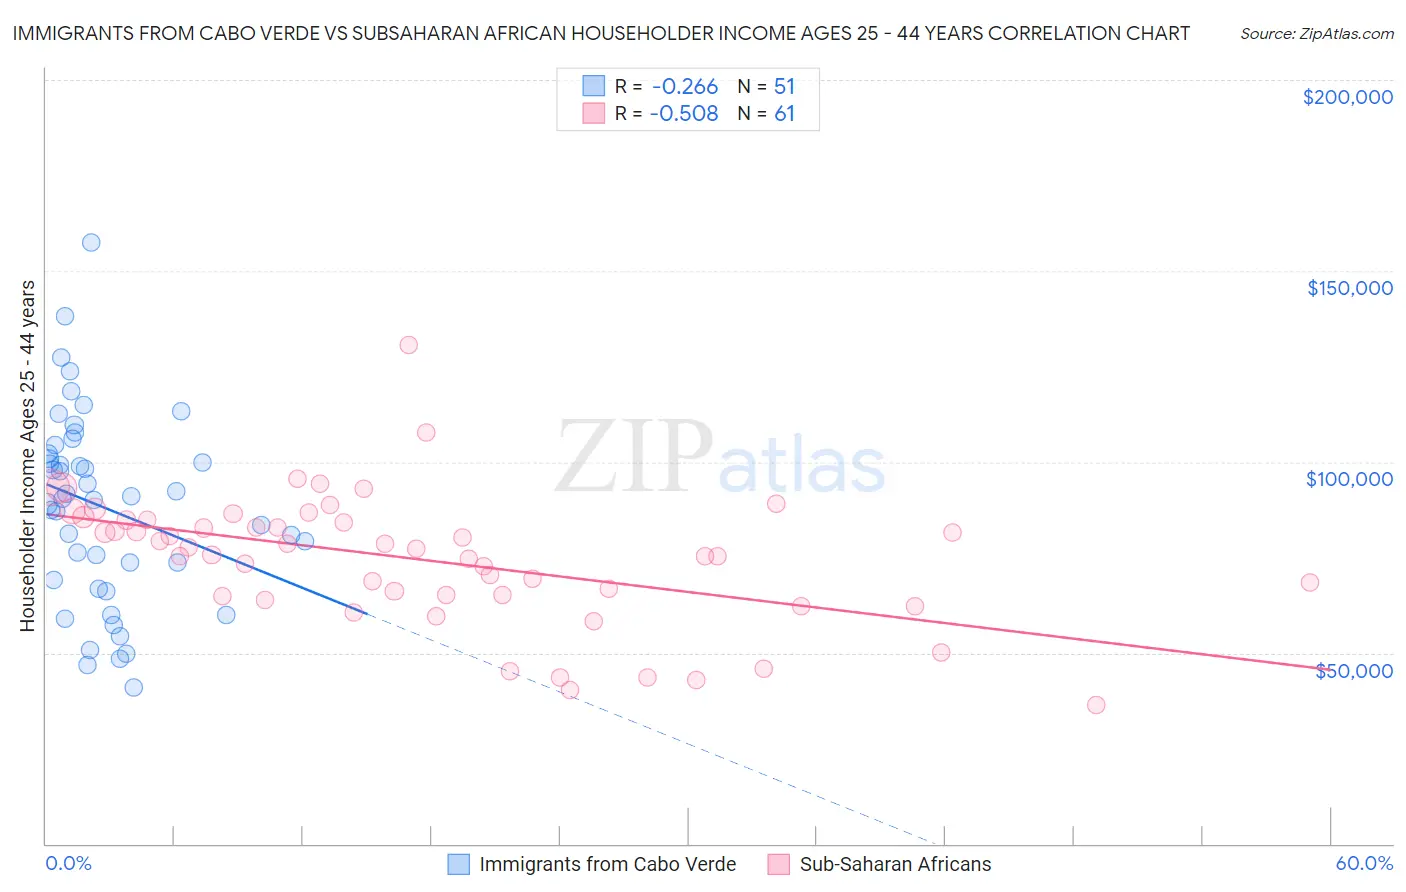
Immigrants from Cabo Verde vs Subsaharan African Householder Income Ages 25 - 44 years Correlation Chart
The statistical analysis conducted on geographies consisting of 38,130,203 people shows a weak negative correlation between the proportion of Immigrants from Cabo Verde and household income with householder between the ages 25 and 44 in the United States with a correlation coefficient (R) of -0.266 and weighted average of $84,304. Similarly, the statistical analysis conducted on geographies consisting of 505,523,200 people shows a substantial negative correlation between the proportion of Sub-Saharan Africans and household income with householder between the ages 25 and 44 in the United States with a correlation coefficient (R) of -0.508 and weighted average of $84,235, a difference of 0.080%.
Householder Income Ages 25 - 44 years Correlation Summary
| Measurement | Immigrants from Cabo Verde | Subsaharan African |
| Minimum | $41,033 | $36,409 |
| Maximum | $157,447 | $130,453 |
| Range | $116,414 | $94,044 |
| Mean | $88,098 | $74,443 |
| Median | $90,262 | $77,380 |
| Interquartile 25% (IQ1) | $68,956 | $65,093 |
| Interquartile 75% (IQ3) | $102,154 | $84,848 |
| Interquartile Range (IQR) | $33,198 | $19,755 |
| Standard Deviation (Sample) | $24,804 | $17,109 |
| Standard Deviation (Population) | $24,559 | $16,968 |
Demographics Similar to Immigrants from Cabo Verde and Sub-Saharan Africans by Householder Income Ages 25 - 44 years
In terms of householder income ages 25 - 44 years, the demographic groups most similar to Immigrants from Cabo Verde are Hmong ($84,258, a difference of 0.050%), Sudanese ($84,401, a difference of 0.12%), Osage ($84,461, a difference of 0.19%), Spanish American Indian ($84,085, a difference of 0.26%), and Belizean ($84,534, a difference of 0.27%). Similarly, the demographic groups most similar to Sub-Saharan Africans are Hmong ($84,258, a difference of 0.030%), Spanish American Indian ($84,085, a difference of 0.18%), Sudanese ($84,401, a difference of 0.20%), Osage ($84,461, a difference of 0.27%), and Belizean ($84,534, a difference of 0.36%).
| Demographics | Rating | Rank | Householder Income Ages 25 - 44 years |
| Mexican American Indians | 0.5 /100 | #257 | Tragic $85,066 |
| Immigrants | Nicaragua | 0.5 /100 | #258 | Tragic $84,914 |
| Immigrants | Senegal | 0.5 /100 | #259 | Tragic $84,848 |
| Americans | 0.4 /100 | #260 | Tragic $84,791 |
| Inupiat | 0.4 /100 | #261 | Tragic $84,619 |
| Cree | 0.4 /100 | #262 | Tragic $84,574 |
| Belizeans | 0.4 /100 | #263 | Tragic $84,534 |
| Osage | 0.4 /100 | #264 | Tragic $84,461 |
| Sudanese | 0.4 /100 | #265 | Tragic $84,401 |
| Immigrants | Cabo Verde | 0.3 /100 | #266 | Tragic $84,304 |
| Hmong | 0.3 /100 | #267 | Tragic $84,258 |
| Sub-Saharan Africans | 0.3 /100 | #268 | Tragic $84,235 |
| Spanish American Indians | 0.3 /100 | #269 | Tragic $84,085 |
| Jamaicans | 0.3 /100 | #270 | Tragic $83,933 |
| Somalis | 0.2 /100 | #271 | Tragic $83,752 |
| Spanish Americans | 0.2 /100 | #272 | Tragic $83,722 |
| Iroquois | 0.2 /100 | #273 | Tragic $83,682 |
| Marshallese | 0.2 /100 | #274 | Tragic $83,575 |
| Immigrants | Jamaica | 0.2 /100 | #275 | Tragic $83,298 |
| Immigrants | Belize | 0.2 /100 | #276 | Tragic $83,141 |
| Paiute | 0.2 /100 | #277 | Tragic $82,984 |