Immigrants from Cabo Verde vs Scottish Householder Income Ages 25 - 44 years
COMPARE
Immigrants from Cabo Verde
Scottish
Householder Income Ages 25 - 44 years
Householder Income Ages 25 - 44 years Comparison
Immigrants from Cabo Verde
Scottish
$84,304
HOUSEHOLDER INCOME AGES 25 - 44 YEARS
0.3/ 100
METRIC RATING
266th/ 347
METRIC RANK
$94,622
HOUSEHOLDER INCOME AGES 25 - 44 YEARS
50.8/ 100
METRIC RATING
172nd/ 347
METRIC RANK
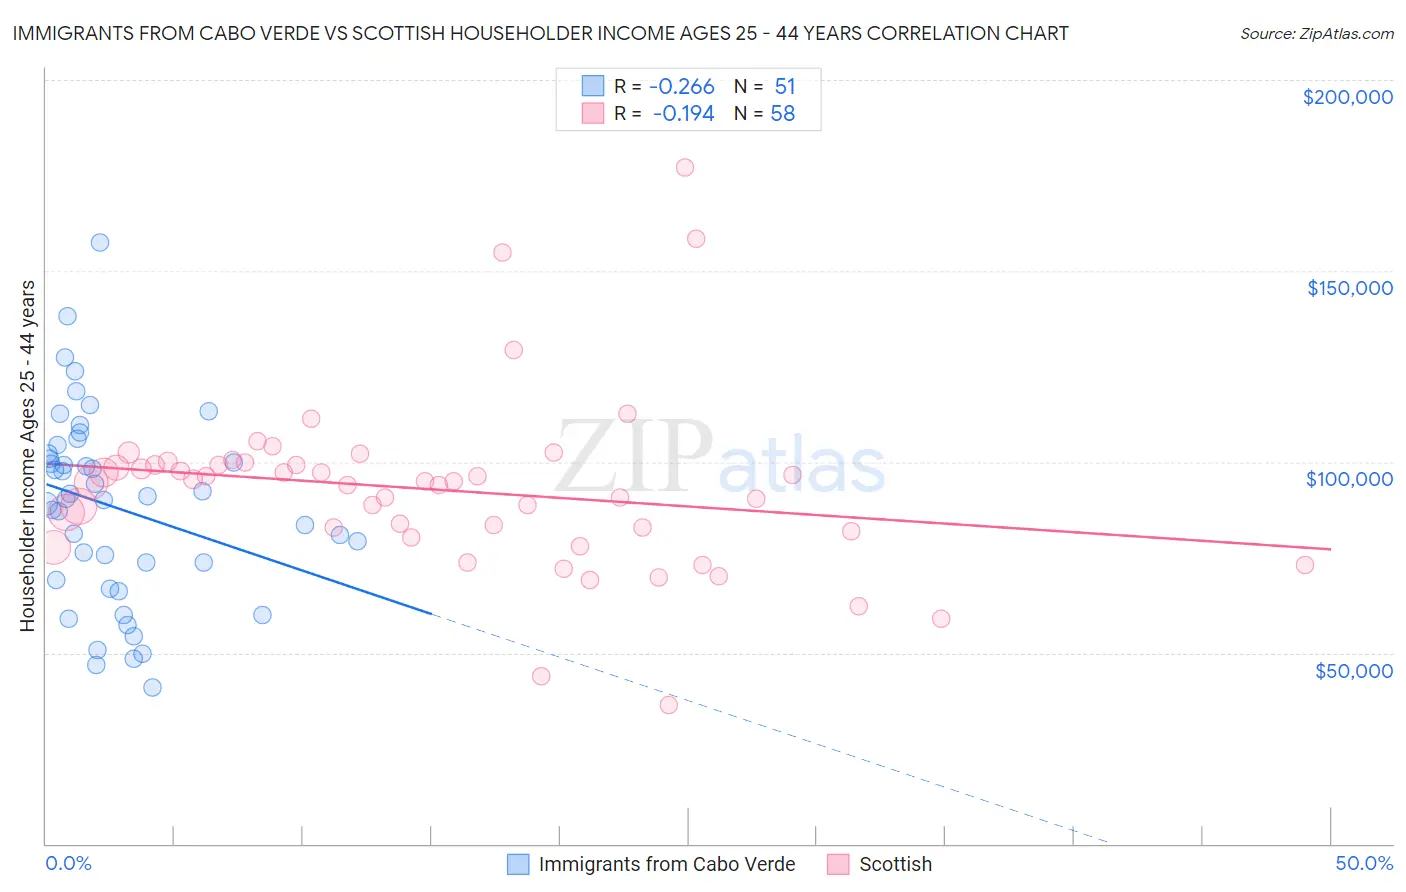
Immigrants from Cabo Verde vs Scottish Householder Income Ages 25 - 44 years Correlation Chart
The statistical analysis conducted on geographies consisting of 38,130,203 people shows a weak negative correlation between the proportion of Immigrants from Cabo Verde and household income with householder between the ages 25 and 44 in the United States with a correlation coefficient (R) of -0.266 and weighted average of $84,304. Similarly, the statistical analysis conducted on geographies consisting of 561,360,199 people shows a poor negative correlation between the proportion of Scottish and household income with householder between the ages 25 and 44 in the United States with a correlation coefficient (R) of -0.194 and weighted average of $94,622, a difference of 12.2%.
Householder Income Ages 25 - 44 years Correlation Summary
| Measurement | Immigrants from Cabo Verde | Scottish |
| Minimum | $41,033 | $36,186 |
| Maximum | $157,447 | $177,052 |
| Range | $116,414 | $140,866 |
| Mean | $88,098 | $92,714 |
| Median | $90,262 | $94,762 |
| Interquartile 25% (IQ1) | $68,956 | $81,966 |
| Interquartile 75% (IQ3) | $102,154 | $99,308 |
| Interquartile Range (IQR) | $33,198 | $17,342 |
| Standard Deviation (Sample) | $24,804 | $23,114 |
| Standard Deviation (Population) | $24,559 | $22,914 |
Similar Demographics by Householder Income Ages 25 - 44 years
Demographics Similar to Immigrants from Cabo Verde by Householder Income Ages 25 - 44 years
In terms of householder income ages 25 - 44 years, the demographic groups most similar to Immigrants from Cabo Verde are Hmong ($84,258, a difference of 0.050%), Subsaharan African ($84,235, a difference of 0.080%), Sudanese ($84,401, a difference of 0.12%), Osage ($84,461, a difference of 0.19%), and Spanish American Indian ($84,085, a difference of 0.26%).
| Demographics | Rating | Rank | Householder Income Ages 25 - 44 years |
| Immigrants | Senegal | 0.5 /100 | #259 | Tragic $84,848 |
| Americans | 0.4 /100 | #260 | Tragic $84,791 |
| Inupiat | 0.4 /100 | #261 | Tragic $84,619 |
| Cree | 0.4 /100 | #262 | Tragic $84,574 |
| Belizeans | 0.4 /100 | #263 | Tragic $84,534 |
| Osage | 0.4 /100 | #264 | Tragic $84,461 |
| Sudanese | 0.4 /100 | #265 | Tragic $84,401 |
| Immigrants | Cabo Verde | 0.3 /100 | #266 | Tragic $84,304 |
| Hmong | 0.3 /100 | #267 | Tragic $84,258 |
| Sub-Saharan Africans | 0.3 /100 | #268 | Tragic $84,235 |
| Spanish American Indians | 0.3 /100 | #269 | Tragic $84,085 |
| Jamaicans | 0.3 /100 | #270 | Tragic $83,933 |
| Somalis | 0.2 /100 | #271 | Tragic $83,752 |
| Spanish Americans | 0.2 /100 | #272 | Tragic $83,722 |
| Iroquois | 0.2 /100 | #273 | Tragic $83,682 |
Demographics Similar to Scottish by Householder Income Ages 25 - 44 years
In terms of householder income ages 25 - 44 years, the demographic groups most similar to Scottish are Finnish ($94,610, a difference of 0.010%), Colombian ($94,565, a difference of 0.060%), English ($94,429, a difference of 0.21%), Immigrants ($94,423, a difference of 0.21%), and Immigrants from Armenia ($94,867, a difference of 0.26%).
| Demographics | Rating | Rank | Householder Income Ages 25 - 44 years |
| Immigrants | Nepal | 60.3 /100 | #165 | Good $95,322 |
| Immigrants | Ethiopia | 59.5 /100 | #166 | Average $95,256 |
| Czechoslovakians | 57.0 /100 | #167 | Average $95,070 |
| Alsatians | 56.8 /100 | #168 | Average $95,059 |
| Native Hawaiians | 56.8 /100 | #169 | Average $95,058 |
| Slovaks | 56.4 /100 | #170 | Average $95,032 |
| Immigrants | Armenia | 54.2 /100 | #171 | Average $94,867 |
| Scottish | 50.8 /100 | #172 | Average $94,622 |
| Finns | 50.6 /100 | #173 | Average $94,610 |
| Colombians | 50.0 /100 | #174 | Average $94,565 |
| English | 48.1 /100 | #175 | Average $94,429 |
| Immigrants | Immigrants | 48.0 /100 | #176 | Average $94,423 |
| Belgians | 45.8 /100 | #177 | Average $94,262 |
| Immigrants | South America | 42.8 /100 | #178 | Average $94,042 |
| French Canadians | 38.2 /100 | #179 | Fair $93,694 |