Immigrants from Egypt vs Tongan Householder Income Ages 25 - 44 years
COMPARE
Immigrants from Egypt
Tongan
Householder Income Ages 25 - 44 years
Householder Income Ages 25 - 44 years Comparison
Immigrants from Egypt
Tongans
$103,192
HOUSEHOLDER INCOME AGES 25 - 44 YEARS
99.2/ 100
METRIC RATING
80th/ 347
METRIC RANK
$99,604
HOUSEHOLDER INCOME AGES 25 - 44 YEARS
94.2/ 100
METRIC RATING
113th/ 347
METRIC RANK
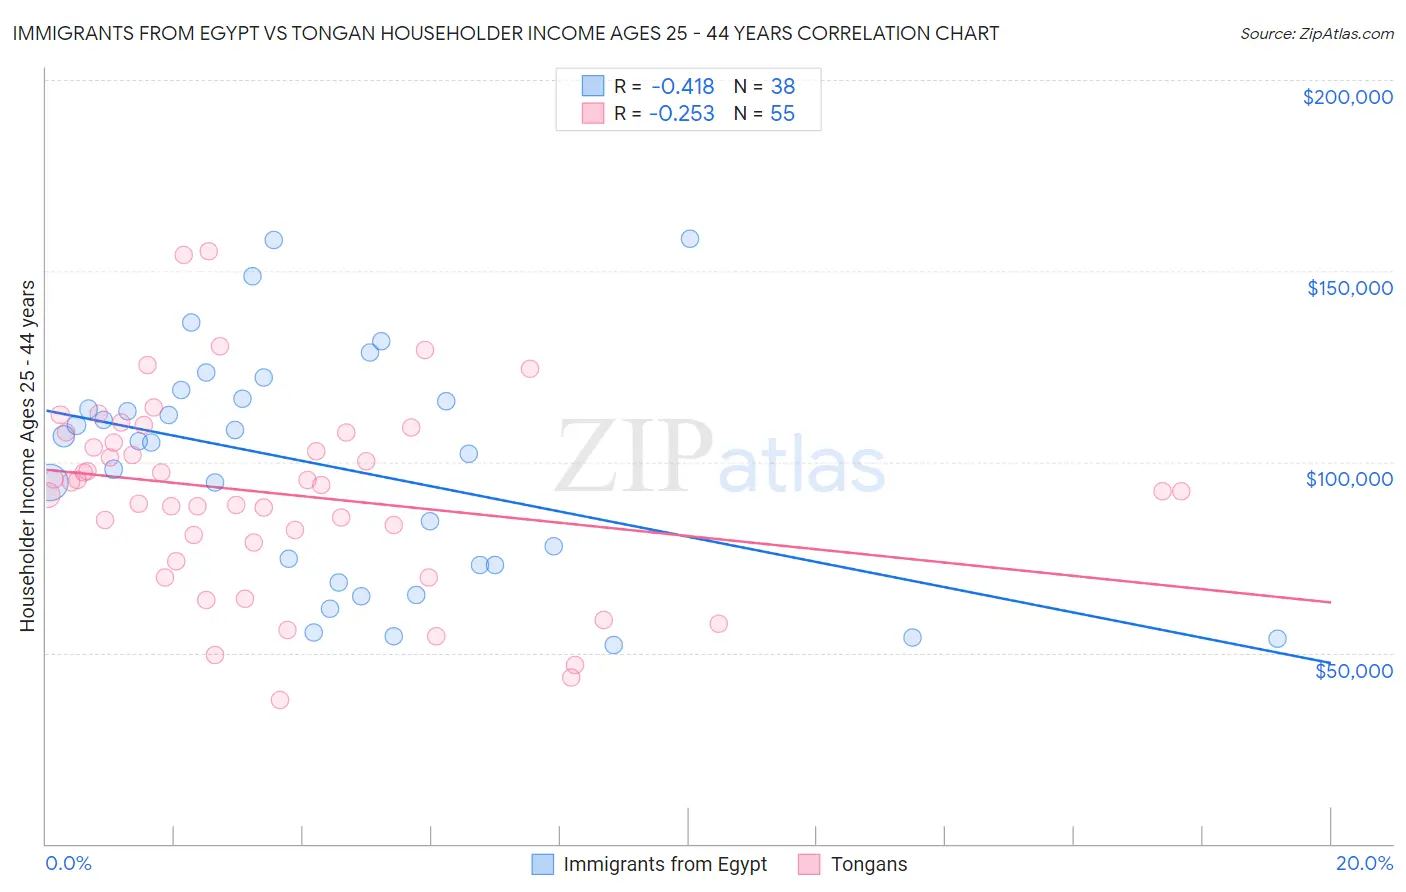
Immigrants from Egypt vs Tongan Householder Income Ages 25 - 44 years Correlation Chart
The statistical analysis conducted on geographies consisting of 245,137,860 people shows a moderate negative correlation between the proportion of Immigrants from Egypt and household income with householder between the ages 25 and 44 in the United States with a correlation coefficient (R) of -0.418 and weighted average of $103,192. Similarly, the statistical analysis conducted on geographies consisting of 102,745,884 people shows a weak negative correlation between the proportion of Tongans and household income with householder between the ages 25 and 44 in the United States with a correlation coefficient (R) of -0.253 and weighted average of $99,604, a difference of 3.6%.
Householder Income Ages 25 - 44 years Correlation Summary
| Measurement | Immigrants from Egypt | Tongan |
| Minimum | $52,083 | $37,778 |
| Maximum | $158,487 | $155,050 |
| Range | $106,404 | $117,272 |
| Mean | $98,589 | $91,685 |
| Median | $105,246 | $93,885 |
| Interquartile 25% (IQ1) | $73,125 | $78,849 |
| Interquartile 75% (IQ3) | $116,638 | $107,550 |
| Interquartile Range (IQR) | $43,513 | $28,701 |
| Standard Deviation (Sample) | $30,067 | $25,126 |
| Standard Deviation (Population) | $29,669 | $24,896 |
Similar Demographics by Householder Income Ages 25 - 44 years
Demographics Similar to Immigrants from Egypt by Householder Income Ages 25 - 44 years
In terms of householder income ages 25 - 44 years, the demographic groups most similar to Immigrants from Egypt are South African ($103,160, a difference of 0.030%), Immigrants from Serbia ($103,155, a difference of 0.040%), Armenian ($103,248, a difference of 0.050%), Argentinean ($103,111, a difference of 0.080%), and Immigrants from Bulgaria ($103,423, a difference of 0.22%).
| Demographics | Rating | Rank | Householder Income Ages 25 - 44 years |
| Italians | 99.5 /100 | #73 | Exceptional $104,215 |
| Immigrants | Fiji | 99.5 /100 | #74 | Exceptional $103,954 |
| Koreans | 99.4 /100 | #75 | Exceptional $103,824 |
| Immigrants | Spain | 99.4 /100 | #76 | Exceptional $103,752 |
| Immigrants | Southern Europe | 99.3 /100 | #77 | Exceptional $103,486 |
| Immigrants | Bulgaria | 99.3 /100 | #78 | Exceptional $103,423 |
| Armenians | 99.2 /100 | #79 | Exceptional $103,248 |
| Immigrants | Egypt | 99.2 /100 | #80 | Exceptional $103,192 |
| South Africans | 99.2 /100 | #81 | Exceptional $103,160 |
| Immigrants | Serbia | 99.2 /100 | #82 | Exceptional $103,155 |
| Argentineans | 99.1 /100 | #83 | Exceptional $103,111 |
| Immigrants | Philippines | 99.0 /100 | #84 | Exceptional $102,910 |
| Immigrants | Ukraine | 98.9 /100 | #85 | Exceptional $102,664 |
| Immigrants | Hungary | 98.9 /100 | #86 | Exceptional $102,655 |
| Immigrants | Western Europe | 98.9 /100 | #87 | Exceptional $102,654 |
Demographics Similar to Tongans by Householder Income Ages 25 - 44 years
In terms of householder income ages 25 - 44 years, the demographic groups most similar to Tongans are Polish ($99,685, a difference of 0.080%), Immigrants from Western Asia ($99,516, a difference of 0.090%), Carpatho Rusyn ($99,449, a difference of 0.16%), Portuguese ($99,429, a difference of 0.18%), and Chilean ($99,900, a difference of 0.30%).
| Demographics | Rating | Rank | Householder Income Ages 25 - 44 years |
| Immigrants | Brazil | 96.5 /100 | #106 | Exceptional $100,534 |
| Northern Europeans | 96.3 /100 | #107 | Exceptional $100,457 |
| Immigrants | South Eastern Asia | 96.0 /100 | #108 | Exceptional $100,283 |
| Immigrants | North Macedonia | 95.6 /100 | #109 | Exceptional $100,101 |
| Immigrants | Afghanistan | 95.3 /100 | #110 | Exceptional $99,977 |
| Chileans | 95.1 /100 | #111 | Exceptional $99,900 |
| Poles | 94.5 /100 | #112 | Exceptional $99,685 |
| Tongans | 94.2 /100 | #113 | Exceptional $99,604 |
| Immigrants | Western Asia | 94.0 /100 | #114 | Exceptional $99,516 |
| Carpatho Rusyns | 93.7 /100 | #115 | Exceptional $99,449 |
| Portuguese | 93.7 /100 | #116 | Exceptional $99,429 |
| Immigrants | Northern Africa | 93.0 /100 | #117 | Exceptional $99,232 |
| Syrians | 92.9 /100 | #118 | Exceptional $99,215 |
| Jordanians | 92.8 /100 | #119 | Exceptional $99,186 |
| Swedes | 92.7 /100 | #120 | Exceptional $99,136 |