Immigrants from Cabo Verde vs Egyptian 10th Grade
COMPARE
Immigrants from Cabo Verde
Egyptian
10th Grade
10th Grade Comparison
Immigrants from Cabo Verde
Egyptians
89.5%
10TH GRADE
0.0/ 100
METRIC RATING
328th/ 347
METRIC RANK
94.0%
10TH GRADE
79.6/ 100
METRIC RATING
150th/ 347
METRIC RANK
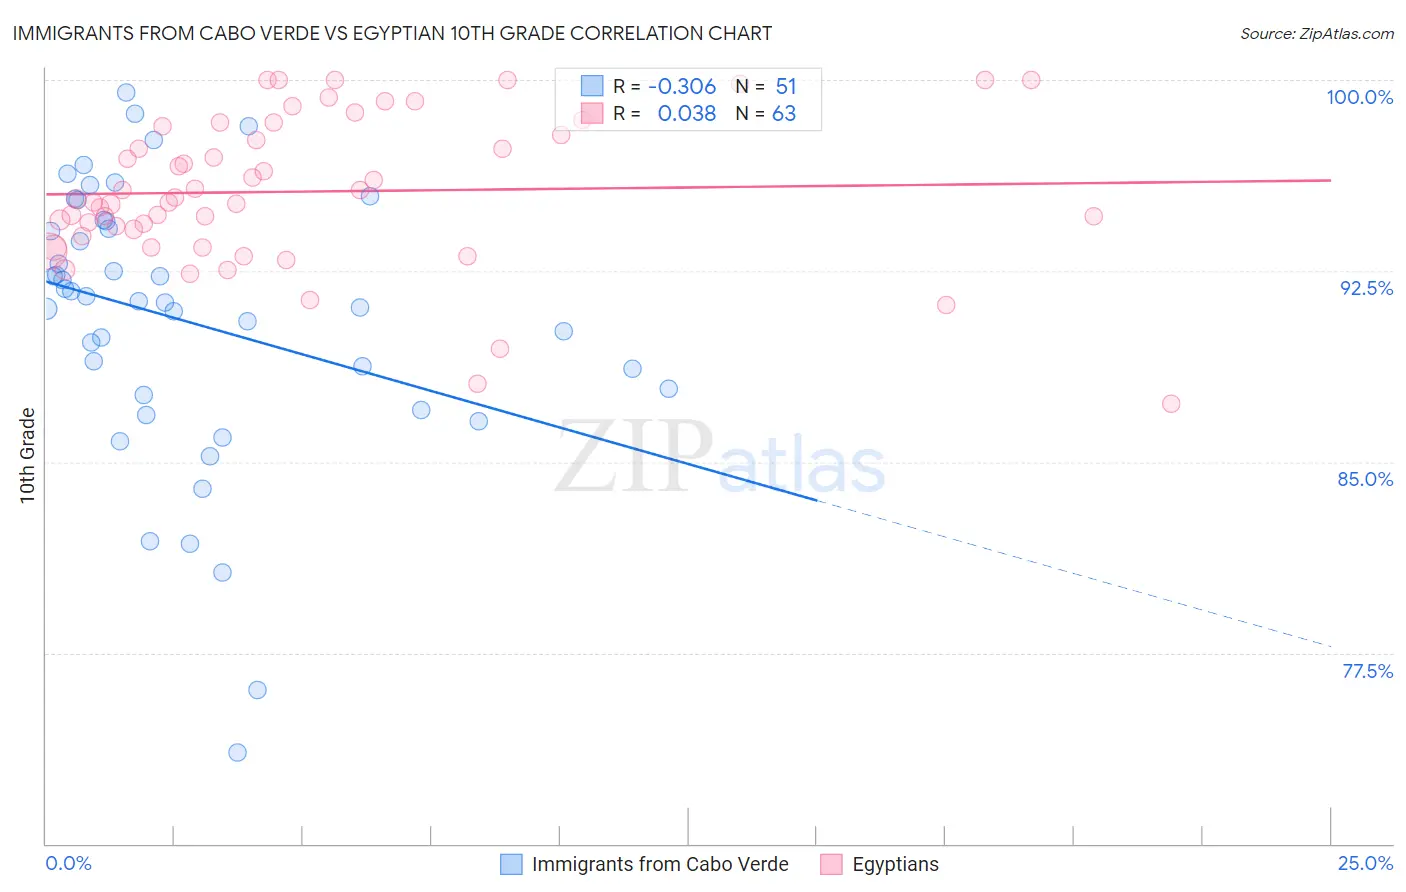
Immigrants from Cabo Verde vs Egyptian 10th Grade Correlation Chart
The statistical analysis conducted on geographies consisting of 38,158,316 people shows a mild negative correlation between the proportion of Immigrants from Cabo Verde and percentage of population with at least 10th grade education in the United States with a correlation coefficient (R) of -0.306 and weighted average of 89.5%. Similarly, the statistical analysis conducted on geographies consisting of 276,927,519 people shows no correlation between the proportion of Egyptians and percentage of population with at least 10th grade education in the United States with a correlation coefficient (R) of 0.038 and weighted average of 94.0%, a difference of 5.1%.
10th Grade Correlation Summary
| Measurement | Immigrants from Cabo Verde | Egyptian |
| Minimum | 73.6% | 87.3% |
| Maximum | 99.5% | 100.0% |
| Range | 25.9% | 12.7% |
| Mean | 90.6% | 95.6% |
| Median | 91.3% | 95.3% |
| Interquartile 25% (IQ1) | 87.6% | 93.9% |
| Interquartile 75% (IQ3) | 94.5% | 98.2% |
| Interquartile Range (IQR) | 6.8% | 4.3% |
| Standard Deviation (Sample) | 5.4% | 2.9% |
| Standard Deviation (Population) | 5.4% | 2.9% |
Similar Demographics by 10th Grade
Demographics Similar to Immigrants from Cabo Verde by 10th Grade
In terms of 10th grade, the demographic groups most similar to Immigrants from Cabo Verde are Immigrants from Nicaragua (89.5%, a difference of 0.010%), Dominican (89.4%, a difference of 0.10%), Central American Indian (89.7%, a difference of 0.27%), Puerto Rican (89.8%, a difference of 0.44%), and Immigrants from Yemen (89.1%, a difference of 0.45%).
| Demographics | Rating | Rank | 10th Grade |
| Belizeans | 0.0 /100 | #321 | Tragic 90.2% |
| Tohono O'odham | 0.0 /100 | #322 | Tragic 90.1% |
| Immigrants | Belize | 0.0 /100 | #323 | Tragic 90.1% |
| Immigrants | Armenia | 0.0 /100 | #324 | Tragic 89.9% |
| Puerto Ricans | 0.0 /100 | #325 | Tragic 89.8% |
| Central American Indians | 0.0 /100 | #326 | Tragic 89.7% |
| Immigrants | Nicaragua | 0.0 /100 | #327 | Tragic 89.5% |
| Immigrants | Cabo Verde | 0.0 /100 | #328 | Tragic 89.5% |
| Dominicans | 0.0 /100 | #329 | Tragic 89.4% |
| Immigrants | Yemen | 0.0 /100 | #330 | Tragic 89.1% |
| Mexican American Indians | 0.0 /100 | #331 | Tragic 89.0% |
| Immigrants | Azores | 0.0 /100 | #332 | Tragic 89.0% |
| Hondurans | 0.0 /100 | #333 | Tragic 89.0% |
| Hispanics or Latinos | 0.0 /100 | #334 | Tragic 88.9% |
| Immigrants | Dominican Republic | 0.0 /100 | #335 | Tragic 88.7% |
Demographics Similar to Egyptians by 10th Grade
In terms of 10th grade, the demographic groups most similar to Egyptians are Kenyan (94.0%, a difference of 0.010%), Arab (94.0%, a difference of 0.020%), Ugandan (94.0%, a difference of 0.020%), Immigrants from Italy (94.0%, a difference of 0.020%), and Immigrants from Ukraine (94.0%, a difference of 0.030%).
| Demographics | Rating | Rank | 10th Grade |
| Cherokee | 84.9 /100 | #143 | Excellent 94.1% |
| Immigrants | Kazakhstan | 84.9 /100 | #144 | Excellent 94.1% |
| Immigrants | Nonimmigrants | 83.8 /100 | #145 | Excellent 94.1% |
| Chickasaw | 82.6 /100 | #146 | Excellent 94.1% |
| Immigrants | Ukraine | 81.5 /100 | #147 | Excellent 94.0% |
| Arabs | 80.9 /100 | #148 | Excellent 94.0% |
| Ugandans | 80.7 /100 | #149 | Excellent 94.0% |
| Egyptians | 79.6 /100 | #150 | Good 94.0% |
| Kenyans | 79.1 /100 | #151 | Good 94.0% |
| Immigrants | Italy | 78.0 /100 | #152 | Good 94.0% |
| Immigrants | Brazil | 75.5 /100 | #153 | Good 94.0% |
| Immigrants | Kenya | 75.3 /100 | #154 | Good 94.0% |
| Spanish | 74.9 /100 | #155 | Good 94.0% |
| Mongolians | 74.4 /100 | #156 | Good 94.0% |
| Kiowa | 73.3 /100 | #157 | Good 93.9% |