Immigrants from Burma/Myanmar vs Immigrants from Philippines Householder Income Ages 25 - 44 years
COMPARE
Immigrants from Burma/Myanmar
Immigrants from Philippines
Householder Income Ages 25 - 44 years
Householder Income Ages 25 - 44 years Comparison
Immigrants from Burma/Myanmar
Immigrants from Philippines
$86,736
HOUSEHOLDER INCOME AGES 25 - 44 YEARS
1.3/ 100
METRIC RATING
246th/ 347
METRIC RANK
$102,910
HOUSEHOLDER INCOME AGES 25 - 44 YEARS
99.0/ 100
METRIC RATING
84th/ 347
METRIC RANK
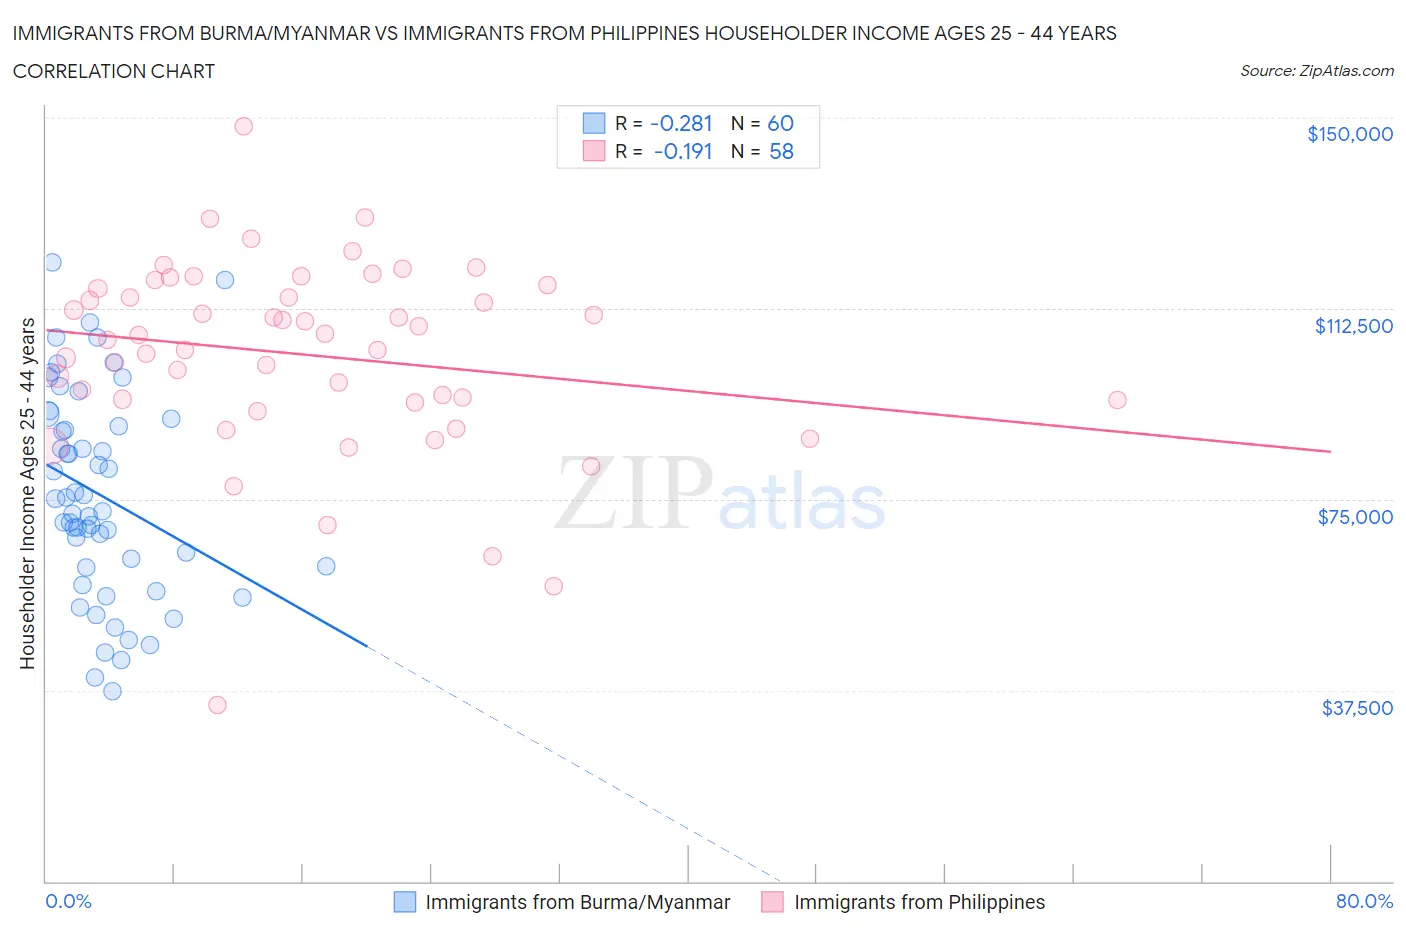
Immigrants from Burma/Myanmar vs Immigrants from Philippines Householder Income Ages 25 - 44 years Correlation Chart
The statistical analysis conducted on geographies consisting of 172,191,155 people shows a weak negative correlation between the proportion of Immigrants from Burma/Myanmar and household income with householder between the ages 25 and 44 in the United States with a correlation coefficient (R) of -0.281 and weighted average of $86,736. Similarly, the statistical analysis conducted on geographies consisting of 469,744,138 people shows a poor negative correlation between the proportion of Immigrants from Philippines and household income with householder between the ages 25 and 44 in the United States with a correlation coefficient (R) of -0.191 and weighted average of $102,910, a difference of 18.6%.
Householder Income Ages 25 - 44 years Correlation Summary
| Measurement | Immigrants from Burma/Myanmar | Immigrants from Philippines |
| Minimum | $37,365 | $34,643 |
| Maximum | $121,540 | $148,401 |
| Range | $84,175 | $113,758 |
| Mean | $75,885 | $103,402 |
| Median | $73,968 | $106,816 |
| Interquartile 25% (IQ1) | $61,794 | $94,583 |
| Interquartile 75% (IQ3) | $90,078 | $116,347 |
| Interquartile Range (IQR) | $28,284 | $21,764 |
| Standard Deviation (Sample) | $20,099 | $19,015 |
| Standard Deviation (Population) | $19,931 | $18,850 |
Similar Demographics by Householder Income Ages 25 - 44 years
Demographics Similar to Immigrants from Burma/Myanmar by Householder Income Ages 25 - 44 years
In terms of householder income ages 25 - 44 years, the demographic groups most similar to Immigrants from Burma/Myanmar are Immigrants from Nigeria ($86,589, a difference of 0.17%), Immigrants from El Salvador ($86,913, a difference of 0.20%), Immigrants from Venezuela ($87,038, a difference of 0.35%), Immigrants from West Indies ($87,063, a difference of 0.38%), and West Indian ($87,205, a difference of 0.54%).
| Demographics | Rating | Rank | Householder Income Ages 25 - 44 years |
| Immigrants | Ghana | 2.2 /100 | #239 | Tragic $87,760 |
| Nicaraguans | 2.2 /100 | #240 | Tragic $87,751 |
| Nigerians | 2.2 /100 | #241 | Tragic $87,730 |
| West Indians | 1.7 /100 | #242 | Tragic $87,205 |
| Immigrants | West Indies | 1.5 /100 | #243 | Tragic $87,063 |
| Immigrants | Venezuela | 1.5 /100 | #244 | Tragic $87,038 |
| Immigrants | El Salvador | 1.4 /100 | #245 | Tragic $86,913 |
| Immigrants | Burma/Myanmar | 1.3 /100 | #246 | Tragic $86,736 |
| Immigrants | Nigeria | 1.2 /100 | #247 | Tragic $86,589 |
| Immigrants | Sudan | 0.9 /100 | #248 | Tragic $86,109 |
| French American Indians | 0.8 /100 | #249 | Tragic $85,899 |
| Pennsylvania Germans | 0.8 /100 | #250 | Tragic $85,836 |
| Cape Verdeans | 0.8 /100 | #251 | Tragic $85,758 |
| Immigrants | Western Africa | 0.7 /100 | #252 | Tragic $85,676 |
| British West Indians | 0.7 /100 | #253 | Tragic $85,565 |
Demographics Similar to Immigrants from Philippines by Householder Income Ages 25 - 44 years
In terms of householder income ages 25 - 44 years, the demographic groups most similar to Immigrants from Philippines are Argentinean ($103,111, a difference of 0.20%), South African ($103,160, a difference of 0.24%), Immigrants from Serbia ($103,155, a difference of 0.24%), Immigrants from Ukraine ($102,664, a difference of 0.24%), and Immigrants from Hungary ($102,655, a difference of 0.25%).
| Demographics | Rating | Rank | Householder Income Ages 25 - 44 years |
| Immigrants | Southern Europe | 99.3 /100 | #77 | Exceptional $103,486 |
| Immigrants | Bulgaria | 99.3 /100 | #78 | Exceptional $103,423 |
| Armenians | 99.2 /100 | #79 | Exceptional $103,248 |
| Immigrants | Egypt | 99.2 /100 | #80 | Exceptional $103,192 |
| South Africans | 99.2 /100 | #81 | Exceptional $103,160 |
| Immigrants | Serbia | 99.2 /100 | #82 | Exceptional $103,155 |
| Argentineans | 99.1 /100 | #83 | Exceptional $103,111 |
| Immigrants | Philippines | 99.0 /100 | #84 | Exceptional $102,910 |
| Immigrants | Ukraine | 98.9 /100 | #85 | Exceptional $102,664 |
| Immigrants | Hungary | 98.9 /100 | #86 | Exceptional $102,655 |
| Immigrants | Western Europe | 98.9 /100 | #87 | Exceptional $102,654 |
| Immigrants | Canada | 98.9 /100 | #88 | Exceptional $102,616 |
| Romanians | 98.8 /100 | #89 | Exceptional $102,544 |
| Ukrainians | 98.8 /100 | #90 | Exceptional $102,451 |
| Croatians | 98.7 /100 | #91 | Exceptional $102,414 |