Immigrants from Burma/Myanmar vs Malaysian Householder Income Ages 25 - 44 years
COMPARE
Immigrants from Burma/Myanmar
Malaysian
Householder Income Ages 25 - 44 years
Householder Income Ages 25 - 44 years Comparison
Immigrants from Burma/Myanmar
Malaysians
$86,736
HOUSEHOLDER INCOME AGES 25 - 44 YEARS
1.3/ 100
METRIC RATING
246th/ 347
METRIC RANK
$88,291
HOUSEHOLDER INCOME AGES 25 - 44 YEARS
3.0/ 100
METRIC RATING
233rd/ 347
METRIC RANK
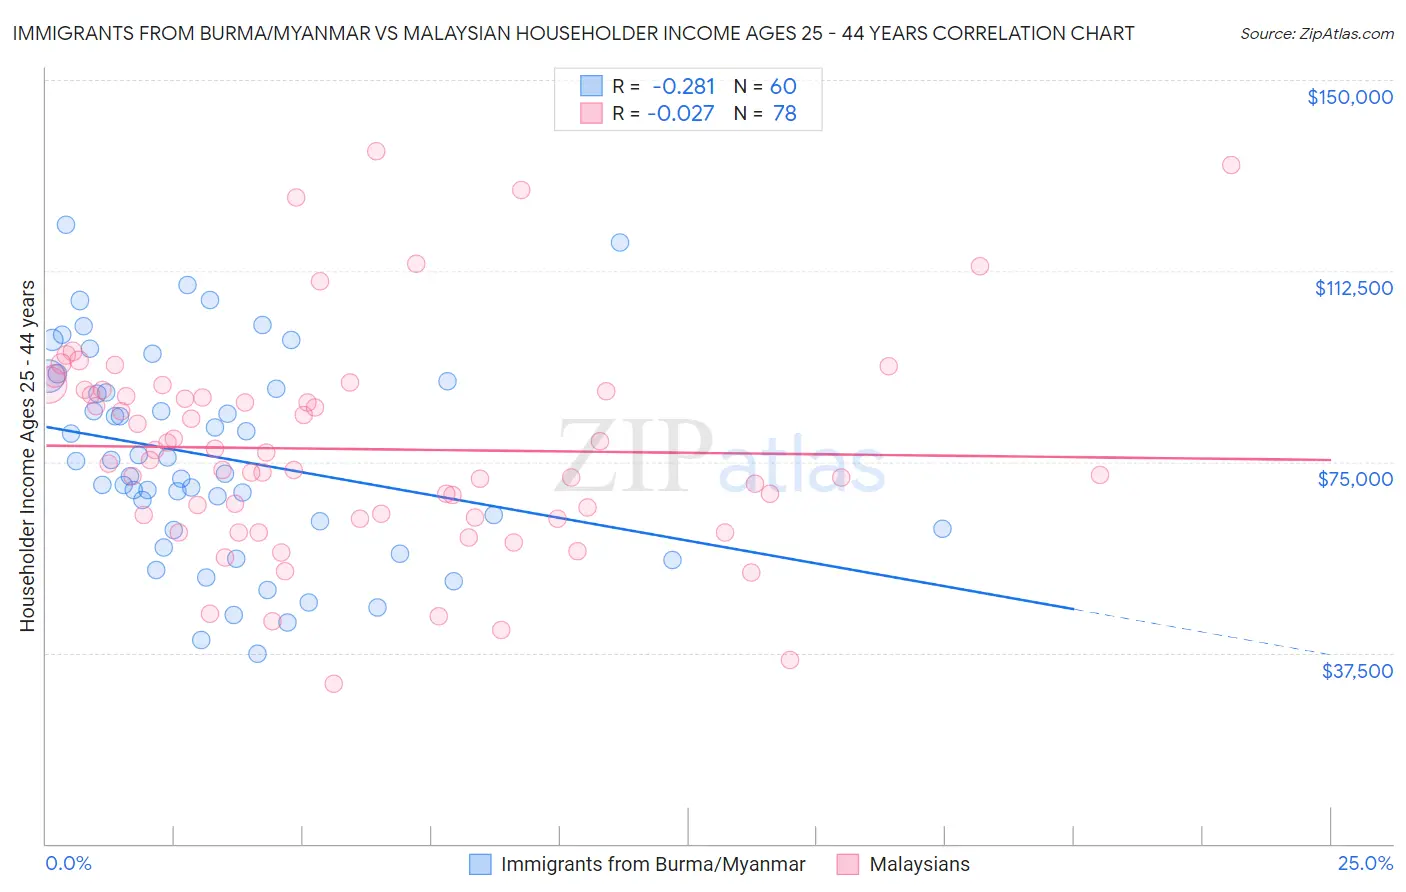
Immigrants from Burma/Myanmar vs Malaysian Householder Income Ages 25 - 44 years Correlation Chart
The statistical analysis conducted on geographies consisting of 172,191,155 people shows a weak negative correlation between the proportion of Immigrants from Burma/Myanmar and household income with householder between the ages 25 and 44 in the United States with a correlation coefficient (R) of -0.281 and weighted average of $86,736. Similarly, the statistical analysis conducted on geographies consisting of 225,821,746 people shows no correlation between the proportion of Malaysians and household income with householder between the ages 25 and 44 in the United States with a correlation coefficient (R) of -0.027 and weighted average of $88,291, a difference of 1.8%.
Householder Income Ages 25 - 44 years Correlation Summary
| Measurement | Immigrants from Burma/Myanmar | Malaysian |
| Minimum | $37,365 | $31,500 |
| Maximum | $121,540 | $135,944 |
| Range | $84,175 | $104,444 |
| Mean | $75,885 | $77,509 |
| Median | $73,968 | $74,995 |
| Interquartile 25% (IQ1) | $61,794 | $64,000 |
| Interquartile 75% (IQ3) | $90,078 | $88,750 |
| Interquartile Range (IQR) | $28,284 | $24,750 |
| Standard Deviation (Sample) | $20,099 | $20,820 |
| Standard Deviation (Population) | $19,931 | $20,686 |
Demographics Similar to Immigrants from Burma/Myanmar and Malaysians by Householder Income Ages 25 - 44 years
In terms of householder income ages 25 - 44 years, the demographic groups most similar to Immigrants from Burma/Myanmar are Immigrants from Nigeria ($86,589, a difference of 0.17%), Immigrants from El Salvador ($86,913, a difference of 0.20%), Immigrants from Venezuela ($87,038, a difference of 0.35%), Immigrants from West Indies ($87,063, a difference of 0.38%), and West Indian ($87,205, a difference of 0.54%). Similarly, the demographic groups most similar to Malaysians are Nonimmigrants ($88,301, a difference of 0.010%), Immigrants from Grenada ($88,311, a difference of 0.020%), Venezuelan ($88,232, a difference of 0.070%), Bermudan ($88,231, a difference of 0.070%), and Immigrants from Cameroon ($88,214, a difference of 0.090%).
| Demographics | Rating | Rank | Householder Income Ages 25 - 44 years |
| Immigrants | Barbados | 3.7 /100 | #229 | Tragic $88,687 |
| Alaskan Athabascans | 3.3 /100 | #230 | Tragic $88,446 |
| Immigrants | Grenada | 3.0 /100 | #231 | Tragic $88,311 |
| Immigrants | Nonimmigrants | 3.0 /100 | #232 | Tragic $88,301 |
| Malaysians | 3.0 /100 | #233 | Tragic $88,291 |
| Venezuelans | 2.9 /100 | #234 | Tragic $88,232 |
| Bermudans | 2.9 /100 | #235 | Tragic $88,231 |
| Immigrants | Cameroon | 2.9 /100 | #236 | Tragic $88,214 |
| Salvadorans | 2.8 /100 | #237 | Tragic $88,198 |
| Alaska Natives | 2.6 /100 | #238 | Tragic $88,018 |
| Immigrants | Ghana | 2.2 /100 | #239 | Tragic $87,760 |
| Nicaraguans | 2.2 /100 | #240 | Tragic $87,751 |
| Nigerians | 2.2 /100 | #241 | Tragic $87,730 |
| West Indians | 1.7 /100 | #242 | Tragic $87,205 |
| Immigrants | West Indies | 1.5 /100 | #243 | Tragic $87,063 |
| Immigrants | Venezuela | 1.5 /100 | #244 | Tragic $87,038 |
| Immigrants | El Salvador | 1.4 /100 | #245 | Tragic $86,913 |
| Immigrants | Burma/Myanmar | 1.3 /100 | #246 | Tragic $86,736 |
| Immigrants | Nigeria | 1.2 /100 | #247 | Tragic $86,589 |
| Immigrants | Sudan | 0.9 /100 | #248 | Tragic $86,109 |
| French American Indians | 0.8 /100 | #249 | Tragic $85,899 |