Guamanian/Chamorro vs Immigrants from Ireland Median Household Income
COMPARE
Guamanian/Chamorro
Immigrants from Ireland
Median Household Income
Median Household Income Comparison
Guamanians/Chamorros
Immigrants from Ireland
$86,255
MEDIAN HOUSEHOLD INCOME
67.7/ 100
METRIC RATING
162nd/ 347
METRIC RANK
$104,692
MEDIAN HOUSEHOLD INCOME
100.0/ 100
METRIC RATING
14th/ 347
METRIC RANK
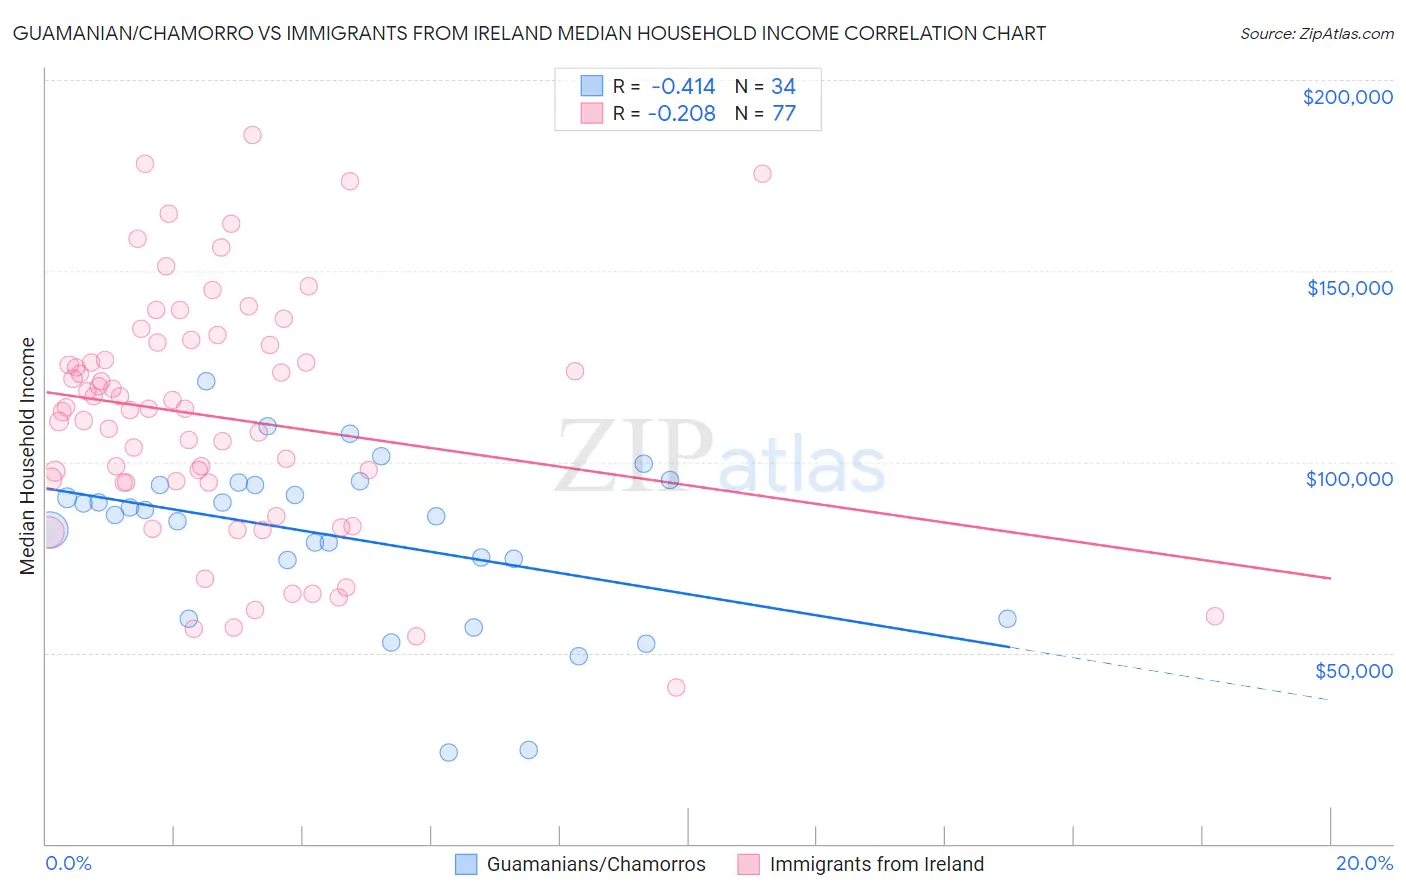
Guamanian/Chamorro vs Immigrants from Ireland Median Household Income Correlation Chart
The statistical analysis conducted on geographies consisting of 221,863,113 people shows a moderate negative correlation between the proportion of Guamanians/Chamorros and median household income in the United States with a correlation coefficient (R) of -0.414 and weighted average of $86,255. Similarly, the statistical analysis conducted on geographies consisting of 240,715,462 people shows a weak negative correlation between the proportion of Immigrants from Ireland and median household income in the United States with a correlation coefficient (R) of -0.208 and weighted average of $104,692, a difference of 21.4%.
Median Household Income Correlation Summary
| Measurement | Guamanian/Chamorro | Immigrants from Ireland |
| Minimum | $23,750 | $40,962 |
| Maximum | $121,240 | $185,464 |
| Range | $97,490 | $144,502 |
| Mean | $80,405 | $111,627 |
| Median | $86,640 | $113,820 |
| Interquartile 25% (IQ1) | $74,171 | $94,548 |
| Interquartile 75% (IQ3) | $94,093 | $130,997 |
| Interquartile Range (IQR) | $19,922 | $36,449 |
| Standard Deviation (Sample) | $22,128 | $31,764 |
| Standard Deviation (Population) | $21,800 | $31,557 |
Similar Demographics by Median Household Income
Demographics Similar to Guamanians/Chamorros by Median Household Income
In terms of median household income, the demographic groups most similar to Guamanians/Chamorros are Czech ($86,164, a difference of 0.11%), Irish ($86,145, a difference of 0.13%), Slavic ($86,398, a difference of 0.17%), Luxembourger ($86,418, a difference of 0.19%), and Immigrants from Uzbekistan ($86,425, a difference of 0.20%).
| Demographics | Rating | Rank | Median Household Income |
| Carpatho Rusyns | 72.8 /100 | #155 | Good $86,635 |
| Immigrants | Albania | 71.5 /100 | #156 | Good $86,534 |
| Samoans | 71.0 /100 | #157 | Good $86,498 |
| Moroccans | 70.6 /100 | #158 | Good $86,468 |
| Immigrants | Uzbekistan | 70.1 /100 | #159 | Good $86,425 |
| Luxembourgers | 70.0 /100 | #160 | Good $86,418 |
| Slavs | 69.7 /100 | #161 | Good $86,398 |
| Guamanians/Chamorros | 67.7 /100 | #162 | Good $86,255 |
| Czechs | 66.4 /100 | #163 | Good $86,164 |
| Irish | 66.2 /100 | #164 | Good $86,145 |
| Norwegians | 65.3 /100 | #165 | Good $86,084 |
| Scandinavians | 65.1 /100 | #166 | Good $86,073 |
| Immigrants | Immigrants | 61.3 /100 | #167 | Good $85,818 |
| Icelanders | 61.0 /100 | #168 | Good $85,797 |
| Colombians | 59.7 /100 | #169 | Average $85,716 |
Demographics Similar to Immigrants from Ireland by Median Household Income
In terms of median household income, the demographic groups most similar to Immigrants from Ireland are Immigrants from Eastern Asia ($104,796, a difference of 0.10%), Indian (Asian) ($105,262, a difference of 0.54%), Immigrants from Israel ($104,090, a difference of 0.58%), Immigrants from China ($105,335, a difference of 0.61%), and Immigrants from South Central Asia ($106,057, a difference of 1.3%).
| Demographics | Rating | Rank | Median Household Income |
| Iranians | 100.0 /100 | #7 | Exceptional $109,835 |
| Immigrants | Iran | 100.0 /100 | #8 | Exceptional $108,055 |
| Okinawans | 100.0 /100 | #9 | Exceptional $106,624 |
| Immigrants | South Central Asia | 100.0 /100 | #10 | Exceptional $106,057 |
| Immigrants | China | 100.0 /100 | #11 | Exceptional $105,335 |
| Indians (Asian) | 100.0 /100 | #12 | Exceptional $105,262 |
| Immigrants | Eastern Asia | 100.0 /100 | #13 | Exceptional $104,796 |
| Immigrants | Ireland | 100.0 /100 | #14 | Exceptional $104,692 |
| Immigrants | Israel | 100.0 /100 | #15 | Exceptional $104,090 |
| Burmese | 100.0 /100 | #16 | Exceptional $103,145 |
| Immigrants | Korea | 100.0 /100 | #17 | Exceptional $102,962 |
| Cypriots | 100.0 /100 | #18 | Exceptional $102,843 |
| Immigrants | Australia | 100.0 /100 | #19 | Exceptional $102,562 |
| Bolivians | 100.0 /100 | #20 | Exceptional $102,195 |
| Eastern Europeans | 100.0 /100 | #21 | Exceptional $101,781 |