Houma vs Argentinean Householder Income Over 65 years
COMPARE
Houma
Argentinean
Householder Income Over 65 years
Householder Income Over 65 years Comparison
Houma
Argentineans
$44,822
HOUSEHOLDER INCOME OVER 65 YEARS
0.0/ 100
METRIC RATING
344th/ 347
METRIC RANK
$65,246
HOUSEHOLDER INCOME OVER 65 YEARS
98.9/ 100
METRIC RATING
72nd/ 347
METRIC RANK
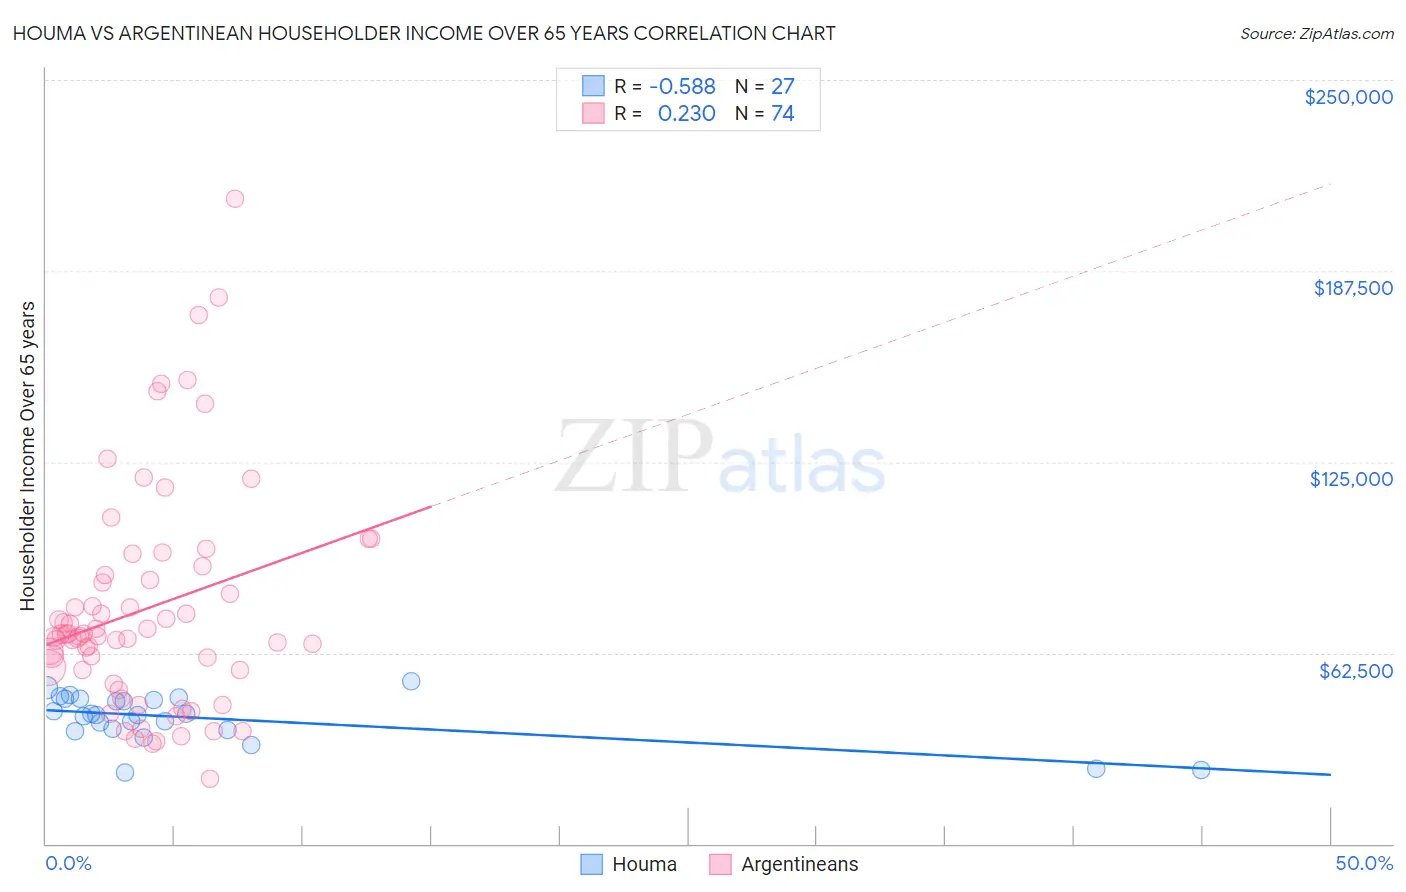
Houma vs Argentinean Householder Income Over 65 years Correlation Chart
The statistical analysis conducted on geographies consisting of 36,737,903 people shows a substantial negative correlation between the proportion of Houma and household income with householder over the age of 65 in the United States with a correlation coefficient (R) of -0.588 and weighted average of $44,822. Similarly, the statistical analysis conducted on geographies consisting of 296,532,812 people shows a weak positive correlation between the proportion of Argentineans and household income with householder over the age of 65 in the United States with a correlation coefficient (R) of 0.230 and weighted average of $65,246, a difference of 45.6%.
Householder Income Over 65 years Correlation Summary
| Measurement | Houma | Argentinean |
| Minimum | $23,495 | $21,406 |
| Maximum | $53,137 | $211,250 |
| Range | $29,642 | $189,844 |
| Mean | $41,091 | $76,897 |
| Median | $42,014 | $68,316 |
| Interquartile 25% (IQ1) | $37,039 | $56,796 |
| Interquartile 75% (IQ3) | $47,429 | $87,790 |
| Interquartile Range (IQR) | $10,390 | $30,994 |
| Standard Deviation (Sample) | $7,902 | $36,797 |
| Standard Deviation (Population) | $7,754 | $36,547 |
Similar Demographics by Householder Income Over 65 years
Demographics Similar to Houma by Householder Income Over 65 years
In terms of householder income over 65 years, the demographic groups most similar to Houma are Immigrants from Cuba ($44,735, a difference of 0.19%), Immigrants from Dominican Republic ($45,758, a difference of 2.1%), Immigrants from Cabo Verde ($46,654, a difference of 4.1%), Dominican ($46,964, a difference of 4.8%), and Puerto Rican ($42,550, a difference of 5.3%).
| Demographics | Rating | Rank | Householder Income Over 65 years |
| Cape Verdeans | 0.0 /100 | #333 | Tragic $50,077 |
| Immigrants | Dominica | 0.0 /100 | #334 | Tragic $50,071 |
| Crow | 0.0 /100 | #335 | Tragic $49,234 |
| Cubans | 0.0 /100 | #336 | Tragic $49,152 |
| Tohono O'odham | 0.0 /100 | #337 | Tragic $49,121 |
| Immigrants | Caribbean | 0.0 /100 | #338 | Tragic $48,535 |
| Navajo | 0.0 /100 | #339 | Tragic $47,722 |
| Immigrants | Yemen | 0.0 /100 | #340 | Tragic $47,527 |
| Dominicans | 0.0 /100 | #341 | Tragic $46,964 |
| Immigrants | Cabo Verde | 0.0 /100 | #342 | Tragic $46,654 |
| Immigrants | Dominican Republic | 0.0 /100 | #343 | Tragic $45,758 |
| Houma | 0.0 /100 | #344 | Tragic $44,822 |
| Immigrants | Cuba | 0.0 /100 | #345 | Tragic $44,735 |
| Puerto Ricans | 0.0 /100 | #346 | Tragic $42,550 |
| Lumbee | 0.0 /100 | #347 | Tragic $40,550 |
Demographics Similar to Argentineans by Householder Income Over 65 years
In terms of householder income over 65 years, the demographic groups most similar to Argentineans are Immigrants from Ethiopia ($65,238, a difference of 0.010%), Lithuanian ($65,209, a difference of 0.060%), Greek ($65,306, a difference of 0.090%), Mongolian ($65,326, a difference of 0.12%), and Samoan ($65,427, a difference of 0.28%).
| Demographics | Rating | Rank | Householder Income Over 65 years |
| Immigrants | England | 99.3 /100 | #65 | Exceptional $65,715 |
| South Africans | 99.3 /100 | #66 | Exceptional $65,652 |
| Immigrants | Malaysia | 99.1 /100 | #67 | Exceptional $65,497 |
| Egyptians | 99.1 /100 | #68 | Exceptional $65,441 |
| Samoans | 99.1 /100 | #69 | Exceptional $65,427 |
| Mongolians | 99.0 /100 | #70 | Exceptional $65,326 |
| Greeks | 98.9 /100 | #71 | Exceptional $65,306 |
| Argentineans | 98.9 /100 | #72 | Exceptional $65,246 |
| Immigrants | Ethiopia | 98.9 /100 | #73 | Exceptional $65,238 |
| Lithuanians | 98.8 /100 | #74 | Exceptional $65,209 |
| Sierra Leoneans | 98.6 /100 | #75 | Exceptional $65,038 |
| Ethiopians | 98.5 /100 | #76 | Exceptional $64,989 |
| Immigrants | Canada | 98.5 /100 | #77 | Exceptional $64,952 |
| Immigrants | Western Europe | 98.5 /100 | #78 | Exceptional $64,933 |
| Hawaiians | 98.4 /100 | #79 | Exceptional $64,920 |