Immigrants from Bosnia and Herzegovina vs Yugoslavian Median Household Income
COMPARE
Immigrants from Bosnia and Herzegovina
Yugoslavian
Median Household Income
Median Household Income Comparison
Immigrants from Bosnia and Herzegovina
Yugoslavians
$79,888
MEDIAN HOUSEHOLD INCOME
3.4/ 100
METRIC RATING
236th/ 347
METRIC RANK
$82,186
MEDIAN HOUSEHOLD INCOME
13.3/ 100
METRIC RATING
216th/ 347
METRIC RANK
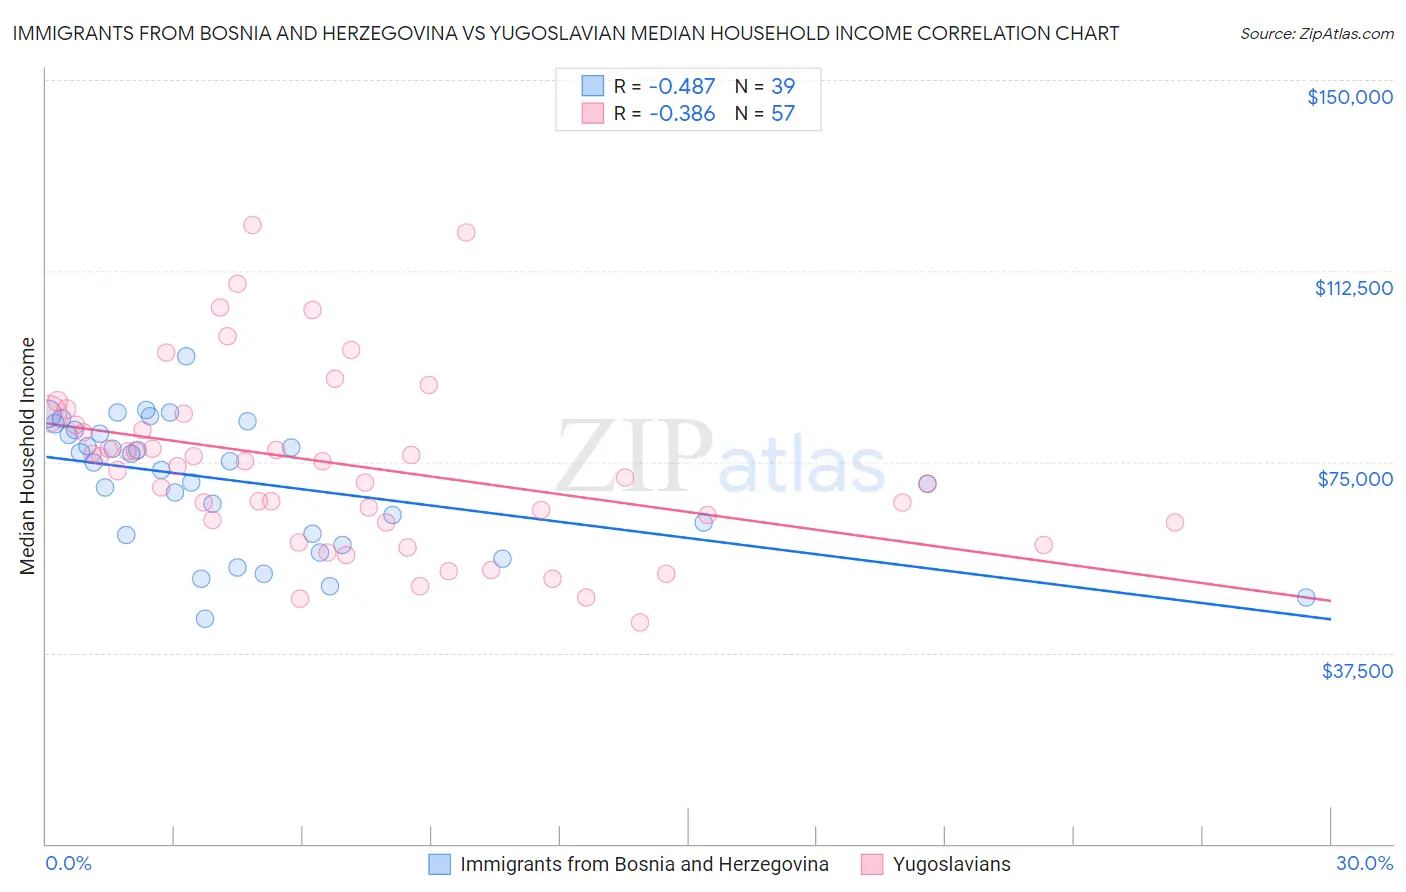
Immigrants from Bosnia and Herzegovina vs Yugoslavian Median Household Income Correlation Chart
The statistical analysis conducted on geographies consisting of 156,785,228 people shows a moderate negative correlation between the proportion of Immigrants from Bosnia and Herzegovina and median household income in the United States with a correlation coefficient (R) of -0.487 and weighted average of $79,888. Similarly, the statistical analysis conducted on geographies consisting of 285,592,338 people shows a mild negative correlation between the proportion of Yugoslavians and median household income in the United States with a correlation coefficient (R) of -0.386 and weighted average of $82,186, a difference of 2.9%.
Median Household Income Correlation Summary
| Measurement | Immigrants from Bosnia and Herzegovina | Yugoslavian |
| Minimum | $44,295 | $43,409 |
| Maximum | $95,813 | $121,486 |
| Range | $51,518 | $78,077 |
| Mean | $71,018 | $74,414 |
| Median | $74,982 | $74,058 |
| Interquartile 25% (IQ1) | $60,735 | $63,141 |
| Interquartile 75% (IQ3) | $81,375 | $83,356 |
| Interquartile Range (IQR) | $20,640 | $20,215 |
| Standard Deviation (Sample) | $12,624 | $17,545 |
| Standard Deviation (Population) | $12,461 | $17,391 |
Demographics Similar to Immigrants from Bosnia and Herzegovina and Yugoslavians by Median Household Income
In terms of median household income, the demographic groups most similar to Immigrants from Bosnia and Herzegovina are Immigrants from Guyana ($80,324, a difference of 0.55%), Immigrants from Ecuador ($80,341, a difference of 0.57%), Immigrants from the Azores ($80,357, a difference of 0.59%), Immigrants from Trinidad and Tobago ($80,373, a difference of 0.61%), and Trinidadian and Tobagonian ($80,402, a difference of 0.64%). Similarly, the demographic groups most similar to Yugoslavians are Ecuadorian ($82,070, a difference of 0.14%), White/Caucasian ($82,029, a difference of 0.19%), Nigerian ($81,725, a difference of 0.56%), Immigrants from Venezuela ($81,506, a difference of 0.83%), and Immigrants from Ghana ($81,489, a difference of 0.86%).
| Demographics | Rating | Rank | Median Household Income |
| Yugoslavians | 13.3 /100 | #216 | Poor $82,186 |
| Ecuadorians | 12.5 /100 | #217 | Poor $82,070 |
| Whites/Caucasians | 12.2 /100 | #218 | Poor $82,029 |
| Nigerians | 10.3 /100 | #219 | Poor $81,725 |
| Immigrants | Venezuela | 9.0 /100 | #220 | Tragic $81,506 |
| Immigrants | Ghana | 9.0 /100 | #221 | Tragic $81,489 |
| Immigrants | Nigeria | 7.7 /100 | #222 | Tragic $81,236 |
| Immigrants | El Salvador | 7.6 /100 | #223 | Tragic $81,213 |
| Malaysians | 7.0 /100 | #224 | Tragic $81,064 |
| Scotch-Irish | 6.6 /100 | #225 | Tragic $80,972 |
| Immigrants | Panama | 6.2 /100 | #226 | Tragic $80,873 |
| Guyanese | 5.7 /100 | #227 | Tragic $80,734 |
| Immigrants | Bangladesh | 5.7 /100 | #228 | Tragic $80,722 |
| Delaware | 5.0 /100 | #229 | Tragic $80,527 |
| Bermudans | 4.7 /100 | #230 | Tragic $80,406 |
| Trinidadians and Tobagonians | 4.7 /100 | #231 | Tragic $80,402 |
| Immigrants | Trinidad and Tobago | 4.6 /100 | #232 | Tragic $80,373 |
| Immigrants | Azores | 4.5 /100 | #233 | Tragic $80,357 |
| Immigrants | Ecuador | 4.5 /100 | #234 | Tragic $80,341 |
| Immigrants | Guyana | 4.5 /100 | #235 | Tragic $80,324 |
| Immigrants | Bosnia and Herzegovina | 3.4 /100 | #236 | Tragic $79,888 |