Immigrants from Bolivia vs Immigrants from Belize Householder Income Ages 25 - 44 years
COMPARE
Immigrants from Bolivia
Immigrants from Belize
Householder Income Ages 25 - 44 years
Householder Income Ages 25 - 44 years Comparison
Immigrants from Bolivia
Immigrants from Belize
$108,128
HOUSEHOLDER INCOME AGES 25 - 44 YEARS
99.9/ 100
METRIC RATING
41st/ 347
METRIC RANK
$83,141
HOUSEHOLDER INCOME AGES 25 - 44 YEARS
0.2/ 100
METRIC RATING
276th/ 347
METRIC RANK
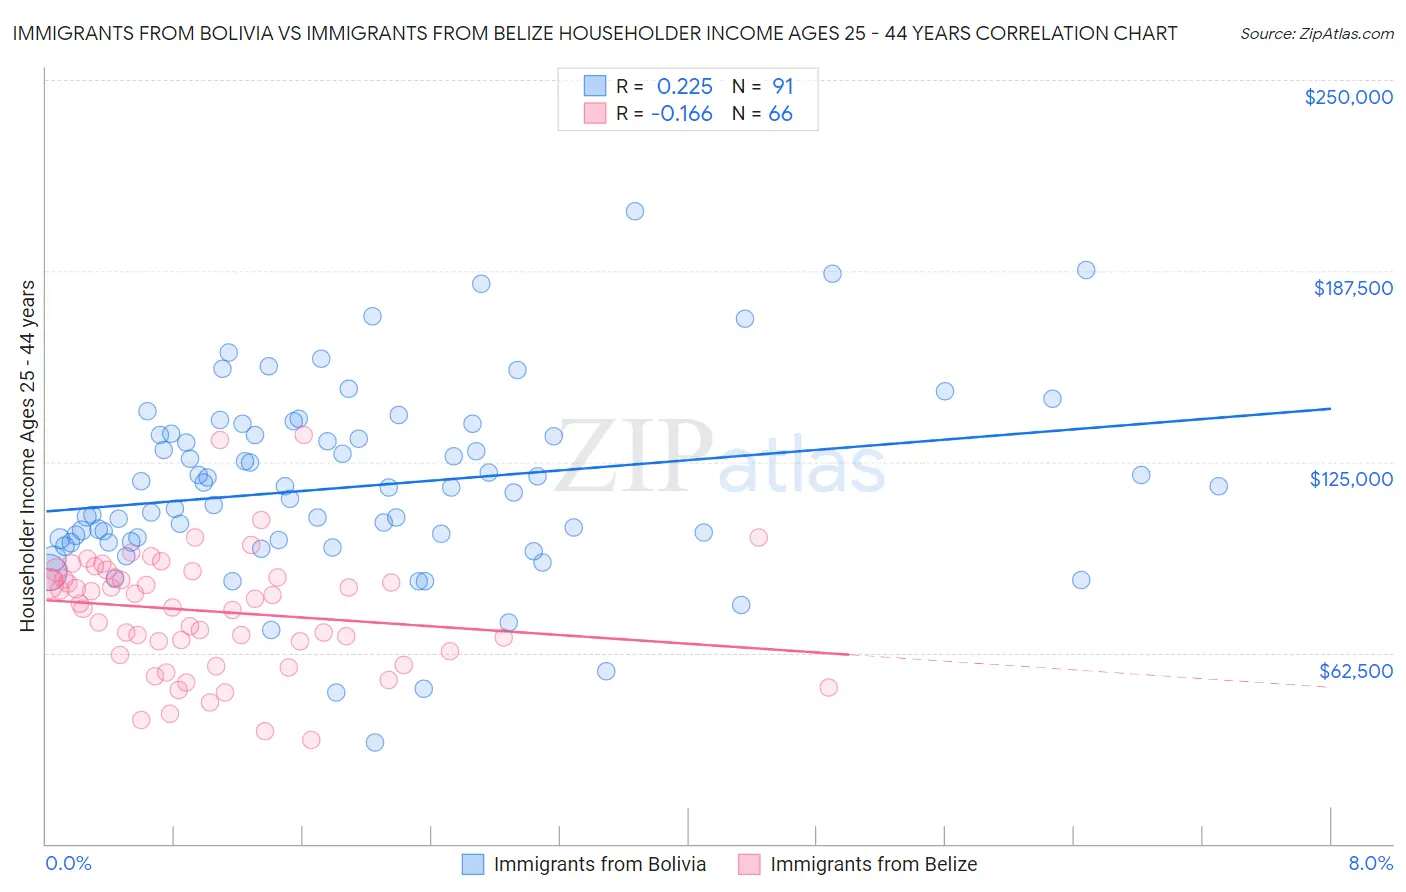
Immigrants from Bolivia vs Immigrants from Belize Householder Income Ages 25 - 44 years Correlation Chart
The statistical analysis conducted on geographies consisting of 158,645,666 people shows a weak positive correlation between the proportion of Immigrants from Bolivia and household income with householder between the ages 25 and 44 in the United States with a correlation coefficient (R) of 0.225 and weighted average of $108,128. Similarly, the statistical analysis conducted on geographies consisting of 130,243,776 people shows a poor negative correlation between the proportion of Immigrants from Belize and household income with householder between the ages 25 and 44 in the United States with a correlation coefficient (R) of -0.166 and weighted average of $83,141, a difference of 30.0%.
Householder Income Ages 25 - 44 years Correlation Summary
| Measurement | Immigrants from Bolivia | Immigrants from Belize |
| Minimum | $33,063 | $33,992 |
| Maximum | $207,065 | $133,906 |
| Range | $174,002 | $99,914 |
| Mean | $117,009 | $76,120 |
| Median | $116,442 | $79,346 |
| Interquartile 25% (IQ1) | $98,830 | $63,154 |
| Interquartile 75% (IQ3) | $133,840 | $87,209 |
| Interquartile Range (IQR) | $35,009 | $24,055 |
| Standard Deviation (Sample) | $30,560 | $19,762 |
| Standard Deviation (Population) | $30,391 | $19,612 |
Similar Demographics by Householder Income Ages 25 - 44 years
Demographics Similar to Immigrants from Bolivia by Householder Income Ages 25 - 44 years
In terms of householder income ages 25 - 44 years, the demographic groups most similar to Immigrants from Bolivia are Immigrants from Lithuania ($108,149, a difference of 0.020%), Immigrants from France ($108,257, a difference of 0.12%), Australian ($107,912, a difference of 0.20%), Soviet Union ($108,457, a difference of 0.30%), and Immigrants from Malaysia ($107,650, a difference of 0.44%).
| Demographics | Rating | Rank | Householder Income Ages 25 - 44 years |
| Bolivians | 100.0 /100 | #34 | Exceptional $109,372 |
| Immigrants | Switzerland | 100.0 /100 | #35 | Exceptional $109,185 |
| Latvians | 100.0 /100 | #36 | Exceptional $108,926 |
| Immigrants | Russia | 100.0 /100 | #37 | Exceptional $108,751 |
| Soviet Union | 100.0 /100 | #38 | Exceptional $108,457 |
| Immigrants | France | 99.9 /100 | #39 | Exceptional $108,257 |
| Immigrants | Lithuania | 99.9 /100 | #40 | Exceptional $108,149 |
| Immigrants | Bolivia | 99.9 /100 | #41 | Exceptional $108,128 |
| Australians | 99.9 /100 | #42 | Exceptional $107,912 |
| Immigrants | Malaysia | 99.9 /100 | #43 | Exceptional $107,650 |
| Immigrants | Indonesia | 99.9 /100 | #44 | Exceptional $107,627 |
| Israelis | 99.9 /100 | #45 | Exceptional $107,579 |
| Immigrants | Belarus | 99.9 /100 | #46 | Exceptional $107,393 |
| Estonians | 99.9 /100 | #47 | Exceptional $107,269 |
| Bulgarians | 99.9 /100 | #48 | Exceptional $107,264 |
Demographics Similar to Immigrants from Belize by Householder Income Ages 25 - 44 years
In terms of householder income ages 25 - 44 years, the demographic groups most similar to Immigrants from Belize are Immigrants from Jamaica ($83,298, a difference of 0.19%), Paiute ($82,984, a difference of 0.19%), Senegalese ($82,852, a difference of 0.35%), Pima ($82,821, a difference of 0.39%), and Marshallese ($83,575, a difference of 0.52%).
| Demographics | Rating | Rank | Householder Income Ages 25 - 44 years |
| Spanish American Indians | 0.3 /100 | #269 | Tragic $84,085 |
| Jamaicans | 0.3 /100 | #270 | Tragic $83,933 |
| Somalis | 0.2 /100 | #271 | Tragic $83,752 |
| Spanish Americans | 0.2 /100 | #272 | Tragic $83,722 |
| Iroquois | 0.2 /100 | #273 | Tragic $83,682 |
| Marshallese | 0.2 /100 | #274 | Tragic $83,575 |
| Immigrants | Jamaica | 0.2 /100 | #275 | Tragic $83,298 |
| Immigrants | Belize | 0.2 /100 | #276 | Tragic $83,141 |
| Paiute | 0.2 /100 | #277 | Tragic $82,984 |
| Senegalese | 0.2 /100 | #278 | Tragic $82,852 |
| Pima | 0.1 /100 | #279 | Tragic $82,821 |
| Colville | 0.1 /100 | #280 | Tragic $82,604 |
| Cajuns | 0.1 /100 | #281 | Tragic $82,393 |
| Central American Indians | 0.1 /100 | #282 | Tragic $82,355 |
| Guatemalans | 0.1 /100 | #283 | Tragic $82,331 |