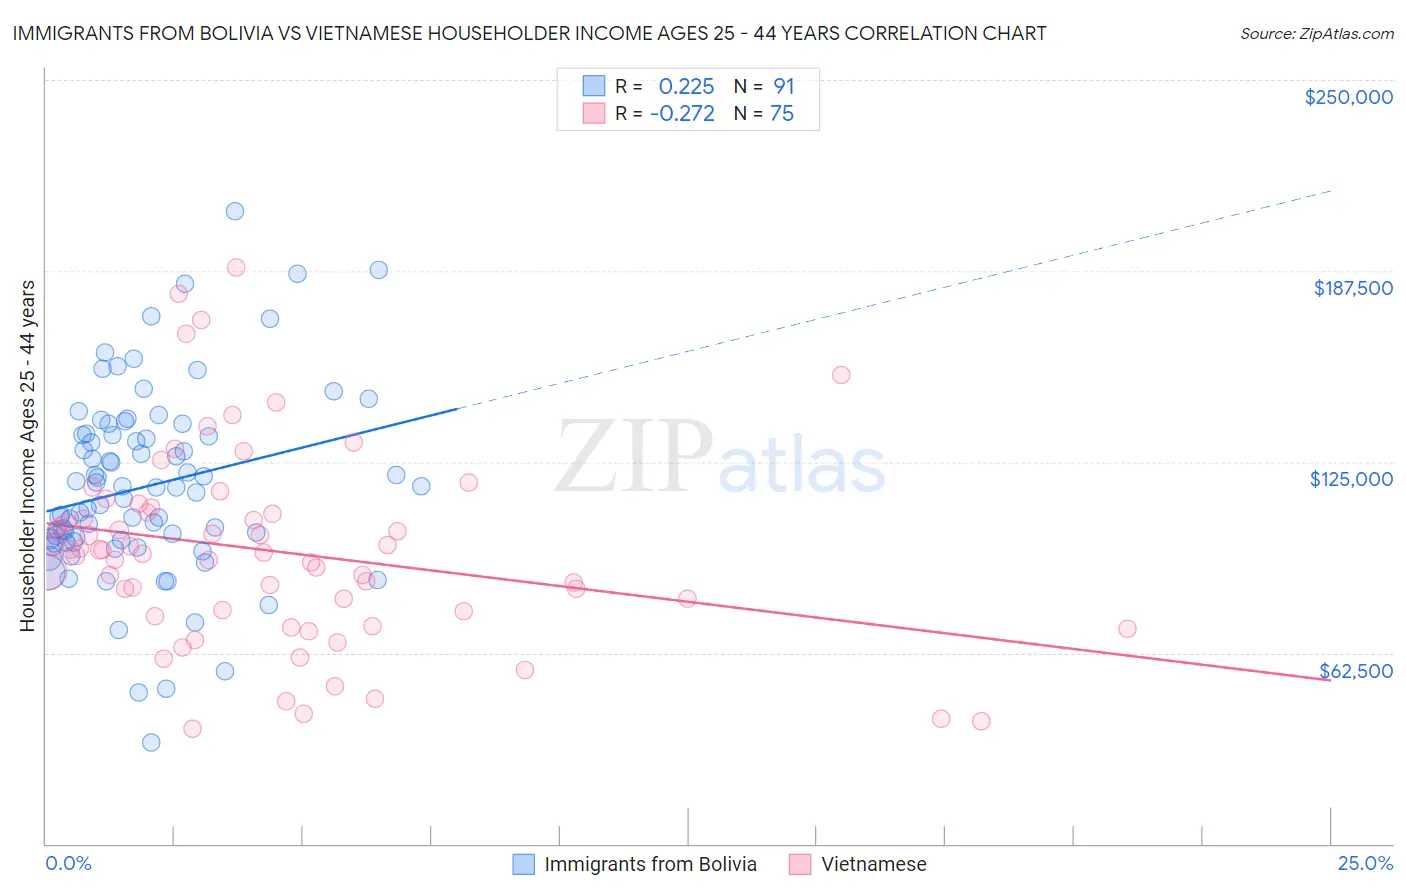
Immigrants from Bolivia vs Vietnamese Householder Income Ages 25 - 44 years
COMPARE
Immigrants from Bolivia
Vietnamese
Householder Income Ages 25 - 44 years
Householder Income Ages 25 - 44 years Comparison
Immigrants from Bolivia
Vietnamese
$108,128
HOUSEHOLDER INCOME AGES 25 - 44 YEARS
99.9/ 100
METRIC RATING
41st/ 347
METRIC RANK
$92,089
HOUSEHOLDER INCOME AGES 25 - 44 YEARS
20.2/ 100
METRIC RATING
198th/ 347
METRIC RANK
Immigrants from Bolivia vs Vietnamese Householder Income Ages 25 - 44 years Correlation Chart
The statistical analysis conducted on geographies consisting of 158,645,666 people shows a weak positive correlation between the proportion of Immigrants from Bolivia and household income with householder between the ages 25 and 44 in the United States with a correlation coefficient (R) of 0.225 and weighted average of $108,128. Similarly, the statistical analysis conducted on geographies consisting of 170,555,303 people shows a weak negative correlation between the proportion of Vietnamese and household income with householder between the ages 25 and 44 in the United States with a correlation coefficient (R) of -0.272 and weighted average of $92,089, a difference of 17.4%.
Householder Income Ages 25 - 44 years Correlation Summary
| Measurement | Immigrants from Bolivia | Vietnamese |
| Minimum | $33,063 | $37,508 |
| Maximum | $207,065 | $188,772 |
| Range | $174,002 | $151,264 |
| Mean | $117,009 | $95,810 |
| Median | $116,442 | $95,390 |
| Interquartile 25% (IQ1) | $98,830 | $76,300 |
| Interquartile 75% (IQ3) | $133,840 | $108,353 |
| Interquartile Range (IQR) | $35,009 | $32,053 |
| Standard Deviation (Sample) | $30,560 | $31,666 |
| Standard Deviation (Population) | $30,391 | $31,454 |
Similar Demographics by Householder Income Ages 25 - 44 years
Demographics Similar to Immigrants from Bolivia by Householder Income Ages 25 - 44 years
In terms of householder income ages 25 - 44 years, the demographic groups most similar to Immigrants from Bolivia are Immigrants from Lithuania ($108,149, a difference of 0.020%), Immigrants from France ($108,257, a difference of 0.12%), Australian ($107,912, a difference of 0.20%), Soviet Union ($108,457, a difference of 0.30%), and Immigrants from Malaysia ($107,650, a difference of 0.44%).
| Demographics | Rating | Rank | Householder Income Ages 25 - 44 years |
| Bolivians | 100.0 /100 | #34 | Exceptional $109,372 |
| Immigrants | Switzerland | 100.0 /100 | #35 | Exceptional $109,185 |
| Latvians | 100.0 /100 | #36 | Exceptional $108,926 |
| Immigrants | Russia | 100.0 /100 | #37 | Exceptional $108,751 |
| Soviet Union | 100.0 /100 | #38 | Exceptional $108,457 |
| Immigrants | France | 99.9 /100 | #39 | Exceptional $108,257 |
| Immigrants | Lithuania | 99.9 /100 | #40 | Exceptional $108,149 |
| Immigrants | Bolivia | 99.9 /100 | #41 | Exceptional $108,128 |
| Australians | 99.9 /100 | #42 | Exceptional $107,912 |
| Immigrants | Malaysia | 99.9 /100 | #43 | Exceptional $107,650 |
| Immigrants | Indonesia | 99.9 /100 | #44 | Exceptional $107,627 |
| Israelis | 99.9 /100 | #45 | Exceptional $107,579 |
| Immigrants | Belarus | 99.9 /100 | #46 | Exceptional $107,393 |
| Estonians | 99.9 /100 | #47 | Exceptional $107,269 |
| Bulgarians | 99.9 /100 | #48 | Exceptional $107,264 |
Demographics Similar to Vietnamese by Householder Income Ages 25 - 44 years
In terms of householder income ages 25 - 44 years, the demographic groups most similar to Vietnamese are Immigrants from Colombia ($92,204, a difference of 0.12%), Spanish ($92,200, a difference of 0.12%), Celtic ($92,241, a difference of 0.16%), Immigrants from the Azores ($92,322, a difference of 0.25%), and Samoan ($92,385, a difference of 0.32%).
| Demographics | Rating | Rank | Householder Income Ages 25 - 44 years |
| Tlingit-Haida | 29.4 /100 | #191 | Fair $92,987 |
| Immigrants | Costa Rica | 28.2 /100 | #192 | Fair $92,876 |
| Samoans | 23.0 /100 | #193 | Fair $92,385 |
| Immigrants | Azores | 22.4 /100 | #194 | Fair $92,322 |
| Celtics | 21.6 /100 | #195 | Fair $92,241 |
| Immigrants | Colombia | 21.3 /100 | #196 | Fair $92,204 |
| Spanish | 21.2 /100 | #197 | Fair $92,200 |
| Vietnamese | 20.2 /100 | #198 | Fair $92,089 |
| Kenyans | 16.8 /100 | #199 | Poor $91,684 |
| Whites/Caucasians | 16.7 /100 | #200 | Poor $91,668 |
| Japanese | 16.4 /100 | #201 | Poor $91,624 |
| Ecuadorians | 16.0 /100 | #202 | Poor $91,574 |
| Immigrants | Cambodia | 15.7 /100 | #203 | Poor $91,533 |
| Nepalese | 15.4 /100 | #204 | Poor $91,498 |
| Immigrants | Eastern Africa | 15.2 /100 | #205 | Poor $91,458 |