Immigrants from Bolivia vs Central American Receiving Food Stamps
COMPARE
Immigrants from Bolivia
Central American
Receiving Food Stamps
Receiving Food Stamps Comparison
Immigrants from Bolivia
Central Americans
9.5%
RECEIVING FOOD STAMPS
99.5/ 100
METRIC RATING
39th/ 347
METRIC RANK
14.1%
RECEIVING FOOD STAMPS
0.3/ 100
METRIC RATING
260th/ 347
METRIC RANK
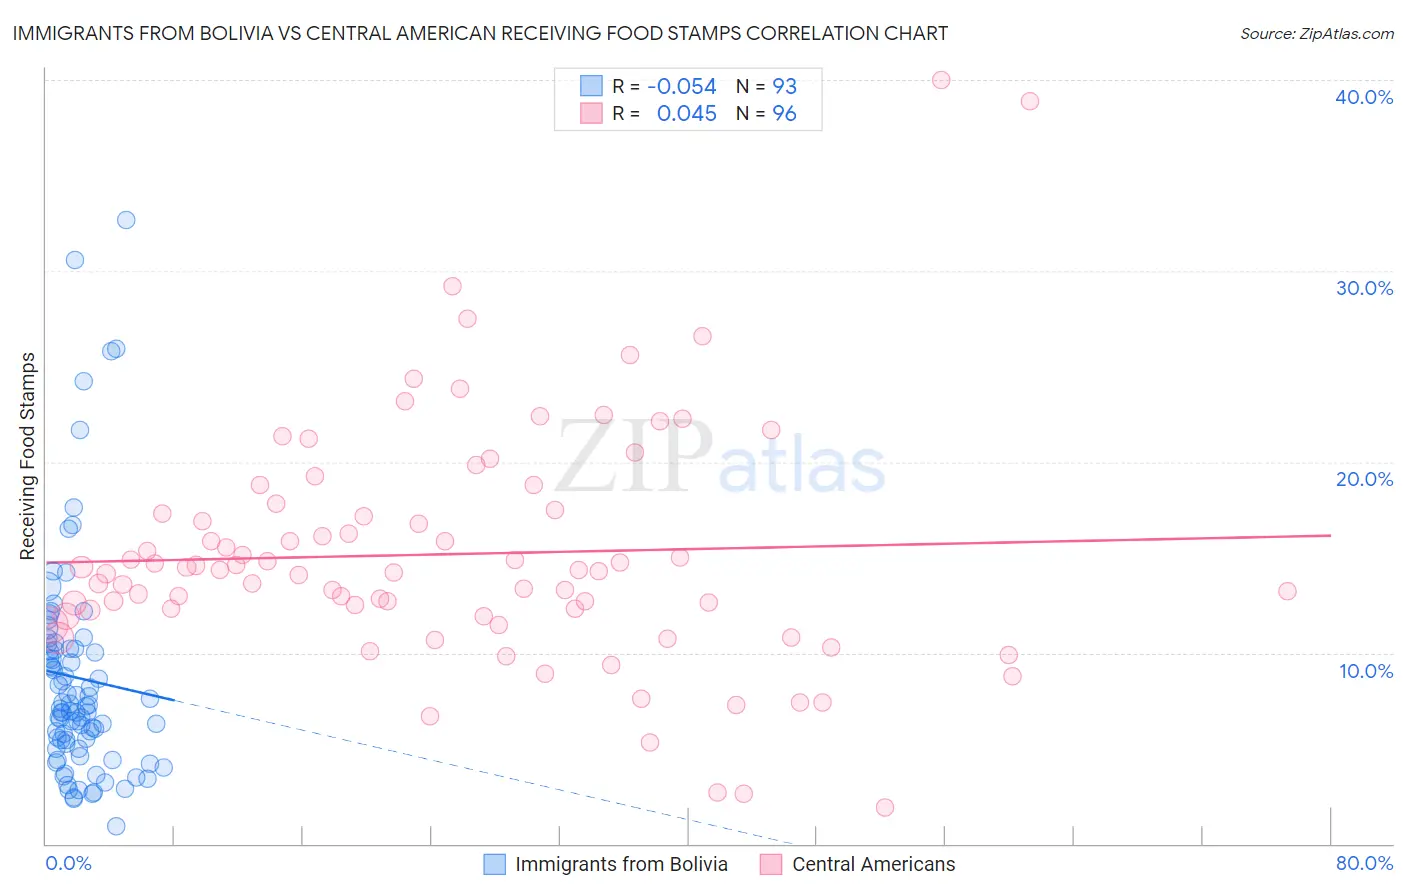
Immigrants from Bolivia vs Central American Receiving Food Stamps Correlation Chart
The statistical analysis conducted on geographies consisting of 158,629,107 people shows a slight negative correlation between the proportion of Immigrants from Bolivia and percentage of population receiving government assistance and/or food stamps in the United States with a correlation coefficient (R) of -0.054 and weighted average of 9.5%. Similarly, the statistical analysis conducted on geographies consisting of 502,597,992 people shows no correlation between the proportion of Central Americans and percentage of population receiving government assistance and/or food stamps in the United States with a correlation coefficient (R) of 0.045 and weighted average of 14.1%, a difference of 48.6%.
Receiving Food Stamps Correlation Summary
| Measurement | Immigrants from Bolivia | Central American |
| Minimum | 0.93% | 1.9% |
| Maximum | 32.7% | 40.0% |
| Range | 31.8% | 38.1% |
| Mean | 8.7% | 15.2% |
| Median | 7.1% | 14.3% |
| Interquartile 25% (IQ1) | 5.1% | 12.1% |
| Interquartile 75% (IQ3) | 10.2% | 17.4% |
| Interquartile Range (IQR) | 5.1% | 5.3% |
| Standard Deviation (Sample) | 5.9% | 6.3% |
| Standard Deviation (Population) | 5.9% | 6.3% |
Similar Demographics by Receiving Food Stamps
Demographics Similar to Immigrants from Bolivia by Receiving Food Stamps
In terms of receiving food stamps, the demographic groups most similar to Immigrants from Bolivia are Immigrants from Sri Lanka (9.5%, a difference of 0.010%), Immigrants from Netherlands (9.5%, a difference of 0.010%), Cambodian (9.5%, a difference of 0.18%), European (9.5%, a difference of 0.30%), and Estonian (9.5%, a difference of 0.37%).
| Demographics | Rating | Rank | Receiving Food Stamps |
| Bolivians | 99.7 /100 | #32 | Exceptional 9.3% |
| Zimbabweans | 99.6 /100 | #33 | Exceptional 9.5% |
| Turks | 99.6 /100 | #34 | Exceptional 9.5% |
| Immigrants | Austria | 99.6 /100 | #35 | Exceptional 9.5% |
| Estonians | 99.6 /100 | #36 | Exceptional 9.5% |
| Europeans | 99.6 /100 | #37 | Exceptional 9.5% |
| Immigrants | Sri Lanka | 99.5 /100 | #38 | Exceptional 9.5% |
| Immigrants | Bolivia | 99.5 /100 | #39 | Exceptional 9.5% |
| Immigrants | Netherlands | 99.5 /100 | #40 | Exceptional 9.5% |
| Cambodians | 99.5 /100 | #41 | Exceptional 9.5% |
| Immigrants | China | 99.5 /100 | #42 | Exceptional 9.6% |
| Croatians | 99.5 /100 | #43 | Exceptional 9.6% |
| Immigrants | Denmark | 99.4 /100 | #44 | Exceptional 9.6% |
| Immigrants | Belgium | 99.4 /100 | #45 | Exceptional 9.6% |
| Australians | 99.4 /100 | #46 | Exceptional 9.6% |
Demographics Similar to Central Americans by Receiving Food Stamps
In terms of receiving food stamps, the demographic groups most similar to Central Americans are Immigrants from Congo (14.1%, a difference of 0.010%), Creek (14.1%, a difference of 0.090%), Immigrants from Ghana (14.1%, a difference of 0.22%), Arapaho (14.1%, a difference of 0.30%), and Japanese (14.1%, a difference of 0.40%).
| Demographics | Rating | Rank | Receiving Food Stamps |
| Spanish Americans | 0.4 /100 | #253 | Tragic 14.0% |
| Marshallese | 0.3 /100 | #254 | Tragic 14.1% |
| Sub-Saharan Africans | 0.3 /100 | #255 | Tragic 14.1% |
| Japanese | 0.3 /100 | #256 | Tragic 14.1% |
| Arapaho | 0.3 /100 | #257 | Tragic 14.1% |
| Immigrants | Ghana | 0.3 /100 | #258 | Tragic 14.1% |
| Creek | 0.3 /100 | #259 | Tragic 14.1% |
| Central Americans | 0.3 /100 | #260 | Tragic 14.1% |
| Immigrants | Congo | 0.3 /100 | #261 | Tragic 14.1% |
| Paiute | 0.2 /100 | #262 | Tragic 14.3% |
| Immigrants | Portugal | 0.2 /100 | #263 | Tragic 14.3% |
| Immigrants | Uzbekistan | 0.2 /100 | #264 | Tragic 14.3% |
| Blackfeet | 0.2 /100 | #265 | Tragic 14.3% |
| Cheyenne | 0.2 /100 | #266 | Tragic 14.3% |
| Dutch West Indians | 0.2 /100 | #267 | Tragic 14.3% |