Hmong vs Puerto Rican Median Family Income
COMPARE
Hmong
Puerto Rican
Median Family Income
Median Family Income Comparison
Hmong
Puerto Ricans
$91,296
MEDIAN FAMILY INCOME
0.3/ 100
METRIC RATING
265th/ 347
METRIC RANK
$70,423
MEDIAN FAMILY INCOME
0.0/ 100
METRIC RATING
346th/ 347
METRIC RANK
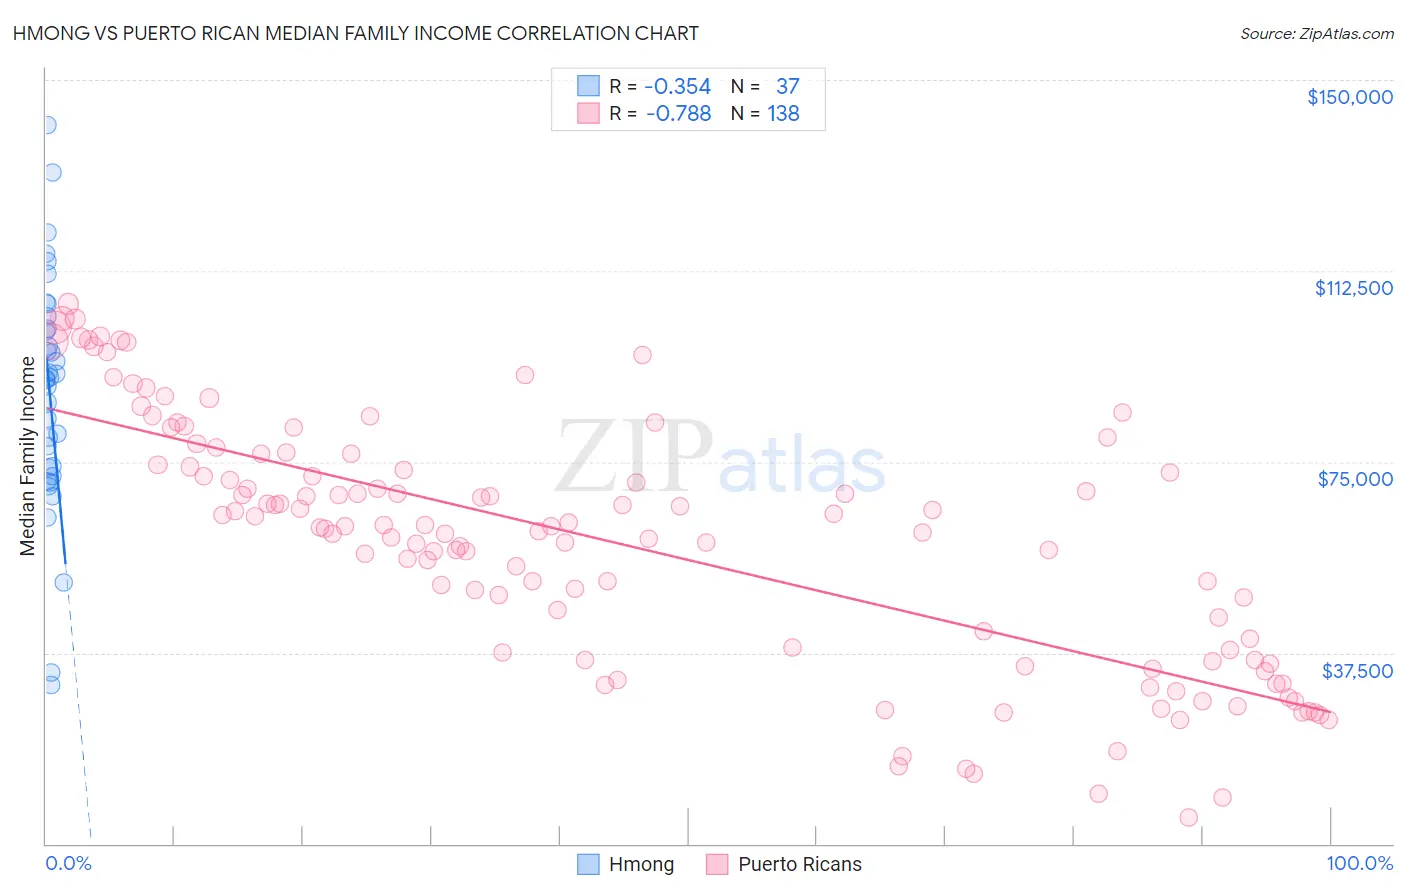
Hmong vs Puerto Rican Median Family Income Correlation Chart
The statistical analysis conducted on geographies consisting of 24,655,529 people shows a mild negative correlation between the proportion of Hmong and median family income in the United States with a correlation coefficient (R) of -0.354 and weighted average of $91,296. Similarly, the statistical analysis conducted on geographies consisting of 527,319,729 people shows a strong negative correlation between the proportion of Puerto Ricans and median family income in the United States with a correlation coefficient (R) of -0.788 and weighted average of $70,423, a difference of 29.6%.
Median Family Income Correlation Summary
| Measurement | Hmong | Puerto Rican |
| Minimum | $31,056 | $5,070 |
| Maximum | $141,078 | $105,977 |
| Range | $110,022 | $100,907 |
| Mean | $88,552 | $59,210 |
| Median | $91,363 | $62,177 |
| Interquartile 25% (IQ1) | $73,027 | $37,461 |
| Interquartile 75% (IQ3) | $102,409 | $74,478 |
| Interquartile Range (IQR) | $29,382 | $37,017 |
| Standard Deviation (Sample) | $23,412 | $24,299 |
| Standard Deviation (Population) | $23,093 | $24,211 |
Similar Demographics by Median Family Income
Demographics Similar to Hmong by Median Family Income
In terms of median family income, the demographic groups most similar to Hmong are Senegalese ($91,475, a difference of 0.20%), Central American ($91,087, a difference of 0.23%), Immigrants from West Indies ($91,588, a difference of 0.32%), Mexican American Indian ($90,918, a difference of 0.42%), and Cree ($90,882, a difference of 0.46%).
| Demographics | Rating | Rank | Median Family Income |
| Osage | 0.4 /100 | #258 | Tragic $91,926 |
| Cape Verdeans | 0.4 /100 | #259 | Tragic $91,848 |
| Pennsylvania Germans | 0.4 /100 | #260 | Tragic $91,763 |
| Inupiat | 0.4 /100 | #261 | Tragic $91,730 |
| Liberians | 0.4 /100 | #262 | Tragic $91,722 |
| Immigrants | West Indies | 0.3 /100 | #263 | Tragic $91,588 |
| Senegalese | 0.3 /100 | #264 | Tragic $91,475 |
| Hmong | 0.3 /100 | #265 | Tragic $91,296 |
| Central Americans | 0.3 /100 | #266 | Tragic $91,087 |
| Mexican American Indians | 0.2 /100 | #267 | Tragic $90,918 |
| Cree | 0.2 /100 | #268 | Tragic $90,882 |
| Belizeans | 0.2 /100 | #269 | Tragic $90,880 |
| Jamaicans | 0.2 /100 | #270 | Tragic $90,581 |
| Iroquois | 0.2 /100 | #271 | Tragic $90,543 |
| Immigrants | Liberia | 0.2 /100 | #272 | Tragic $90,450 |
Demographics Similar to Puerto Ricans by Median Family Income
In terms of median family income, the demographic groups most similar to Puerto Ricans are Navajo ($70,989, a difference of 0.80%), Tohono O'odham ($72,193, a difference of 2.5%), Lumbee ($68,679, a difference of 2.5%), Houma ($76,188, a difference of 8.2%), and Crow ($76,605, a difference of 8.8%).
| Demographics | Rating | Rank | Median Family Income |
| Kiowa | 0.0 /100 | #333 | Tragic $80,885 |
| Menominee | 0.0 /100 | #334 | Tragic $79,563 |
| Yup'ik | 0.0 /100 | #335 | Tragic $79,290 |
| Immigrants | Cuba | 0.0 /100 | #336 | Tragic $78,249 |
| Yuman | 0.0 /100 | #337 | Tragic $78,055 |
| Immigrants | Yemen | 0.0 /100 | #338 | Tragic $77,457 |
| Pima | 0.0 /100 | #339 | Tragic $77,431 |
| Hopi | 0.0 /100 | #340 | Tragic $77,188 |
| Pueblo | 0.0 /100 | #341 | Tragic $76,880 |
| Crow | 0.0 /100 | #342 | Tragic $76,605 |
| Houma | 0.0 /100 | #343 | Tragic $76,188 |
| Tohono O'odham | 0.0 /100 | #344 | Tragic $72,193 |
| Navajo | 0.0 /100 | #345 | Tragic $70,989 |
| Puerto Ricans | 0.0 /100 | #346 | Tragic $70,423 |
| Lumbee | 0.0 /100 | #347 | Tragic $68,679 |