Immigrants from Afghanistan vs Puerto Rican Median Family Income
COMPARE
Immigrants from Afghanistan
Puerto Rican
Median Family Income
Median Family Income Comparison
Immigrants from Afghanistan
Puerto Ricans
$108,709
MEDIAN FAMILY INCOME
95.6/ 100
METRIC RATING
109th/ 347
METRIC RANK
$70,423
MEDIAN FAMILY INCOME
0.0/ 100
METRIC RATING
346th/ 347
METRIC RANK
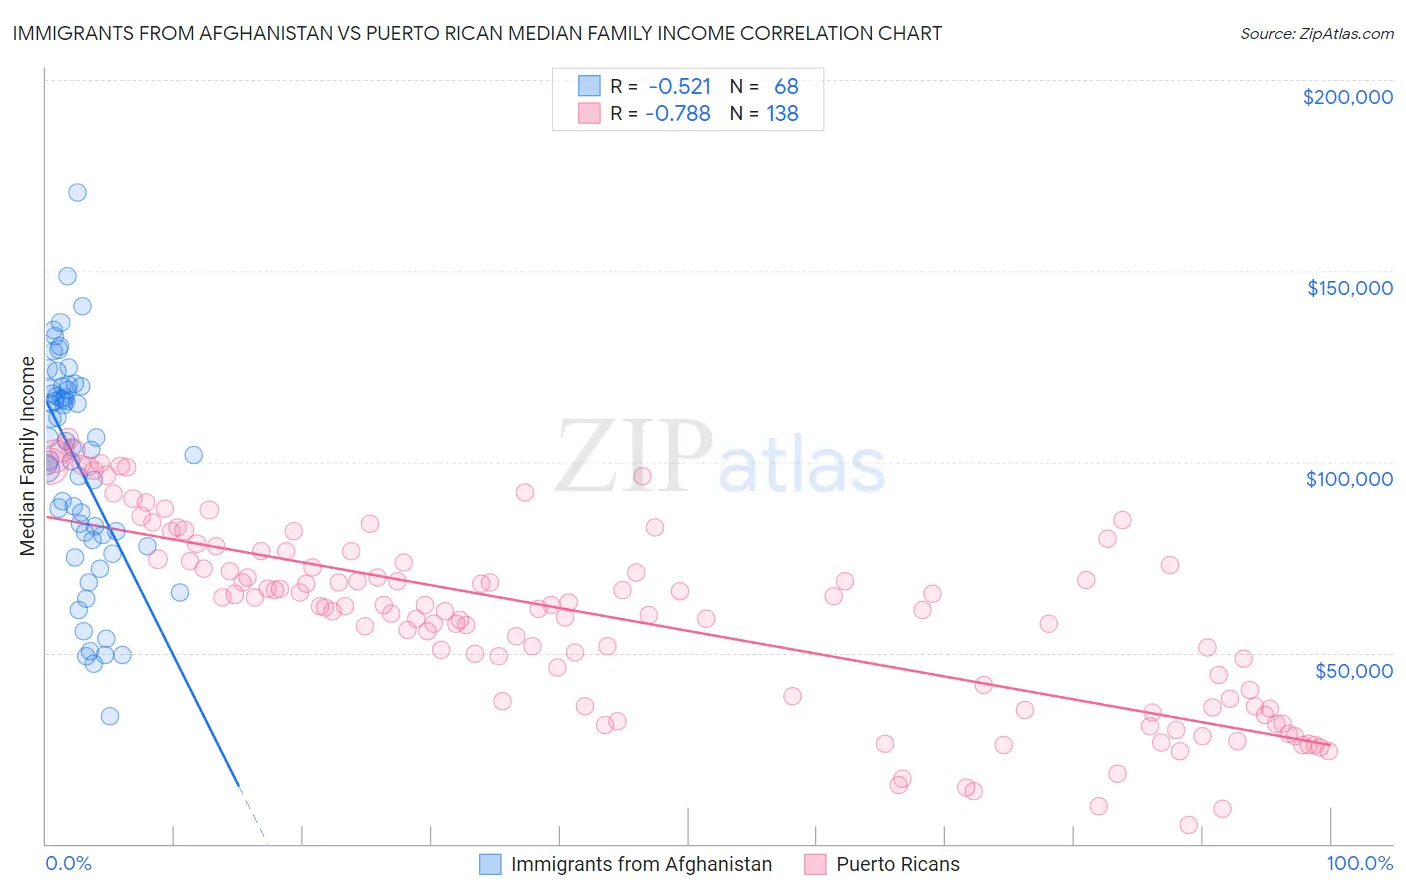
Immigrants from Afghanistan vs Puerto Rican Median Family Income Correlation Chart
The statistical analysis conducted on geographies consisting of 147,629,265 people shows a substantial negative correlation between the proportion of Immigrants from Afghanistan and median family income in the United States with a correlation coefficient (R) of -0.521 and weighted average of $108,709. Similarly, the statistical analysis conducted on geographies consisting of 527,319,729 people shows a strong negative correlation between the proportion of Puerto Ricans and median family income in the United States with a correlation coefficient (R) of -0.788 and weighted average of $70,423, a difference of 54.4%.
Median Family Income Correlation Summary
| Measurement | Immigrants from Afghanistan | Puerto Rican |
| Minimum | $33,250 | $5,070 |
| Maximum | $170,486 | $105,977 |
| Range | $137,236 | $100,907 |
| Mean | $99,044 | $59,210 |
| Median | $103,312 | $62,177 |
| Interquartile 25% (IQ1) | $80,208 | $37,461 |
| Interquartile 75% (IQ3) | $118,974 | $74,478 |
| Interquartile Range (IQR) | $38,766 | $37,017 |
| Standard Deviation (Sample) | $28,337 | $24,299 |
| Standard Deviation (Population) | $28,128 | $24,211 |
Similar Demographics by Median Family Income
Demographics Similar to Immigrants from Afghanistan by Median Family Income
In terms of median family income, the demographic groups most similar to Immigrants from Afghanistan are British ($108,705, a difference of 0.0%), Immigrants from Western Asia ($108,691, a difference of 0.020%), Immigrants from Zimbabwe ($108,830, a difference of 0.11%), Immigrants from Poland ($108,570, a difference of 0.13%), and Immigrants from Saudi Arabia ($108,544, a difference of 0.15%).
| Demographics | Rating | Rank | Median Family Income |
| Assyrians/Chaldeans/Syriacs | 97.2 /100 | #102 | Exceptional $109,622 |
| Immigrants | Brazil | 96.9 /100 | #103 | Exceptional $109,418 |
| Palestinians | 96.9 /100 | #104 | Exceptional $109,413 |
| Syrians | 96.7 /100 | #105 | Exceptional $109,299 |
| Albanians | 96.4 /100 | #106 | Exceptional $109,136 |
| Immigrants | North Macedonia | 96.4 /100 | #107 | Exceptional $109,136 |
| Immigrants | Zimbabwe | 95.9 /100 | #108 | Exceptional $108,830 |
| Immigrants | Afghanistan | 95.6 /100 | #109 | Exceptional $108,709 |
| British | 95.6 /100 | #110 | Exceptional $108,705 |
| Immigrants | Western Asia | 95.6 /100 | #111 | Exceptional $108,691 |
| Immigrants | Poland | 95.3 /100 | #112 | Exceptional $108,570 |
| Immigrants | Saudi Arabia | 95.2 /100 | #113 | Exceptional $108,544 |
| Poles | 95.2 /100 | #114 | Exceptional $108,507 |
| Swedes | 95.1 /100 | #115 | Exceptional $108,499 |
| Chileans | 95.0 /100 | #116 | Exceptional $108,429 |
Demographics Similar to Puerto Ricans by Median Family Income
In terms of median family income, the demographic groups most similar to Puerto Ricans are Navajo ($70,989, a difference of 0.80%), Tohono O'odham ($72,193, a difference of 2.5%), Lumbee ($68,679, a difference of 2.5%), Houma ($76,188, a difference of 8.2%), and Crow ($76,605, a difference of 8.8%).
| Demographics | Rating | Rank | Median Family Income |
| Kiowa | 0.0 /100 | #333 | Tragic $80,885 |
| Menominee | 0.0 /100 | #334 | Tragic $79,563 |
| Yup'ik | 0.0 /100 | #335 | Tragic $79,290 |
| Immigrants | Cuba | 0.0 /100 | #336 | Tragic $78,249 |
| Yuman | 0.0 /100 | #337 | Tragic $78,055 |
| Immigrants | Yemen | 0.0 /100 | #338 | Tragic $77,457 |
| Pima | 0.0 /100 | #339 | Tragic $77,431 |
| Hopi | 0.0 /100 | #340 | Tragic $77,188 |
| Pueblo | 0.0 /100 | #341 | Tragic $76,880 |
| Crow | 0.0 /100 | #342 | Tragic $76,605 |
| Houma | 0.0 /100 | #343 | Tragic $76,188 |
| Tohono O'odham | 0.0 /100 | #344 | Tragic $72,193 |
| Navajo | 0.0 /100 | #345 | Tragic $70,989 |
| Puerto Ricans | 0.0 /100 | #346 | Tragic $70,423 |
| Lumbee | 0.0 /100 | #347 | Tragic $68,679 |