Immigrants from Belgium vs Yup'ik Wage/Income Gap
COMPARE
Immigrants from Belgium
Yup'ik
Wage/Income Gap
Wage/Income Gap Comparison
Immigrants from Belgium
Yup'ik
29.0%
WAGE/INCOME GAP
0.0/ 100
METRIC RATING
326th/ 347
METRIC RANK
24.7%
WAGE/INCOME GAP
93.3/ 100
METRIC RATING
129th/ 347
METRIC RANK
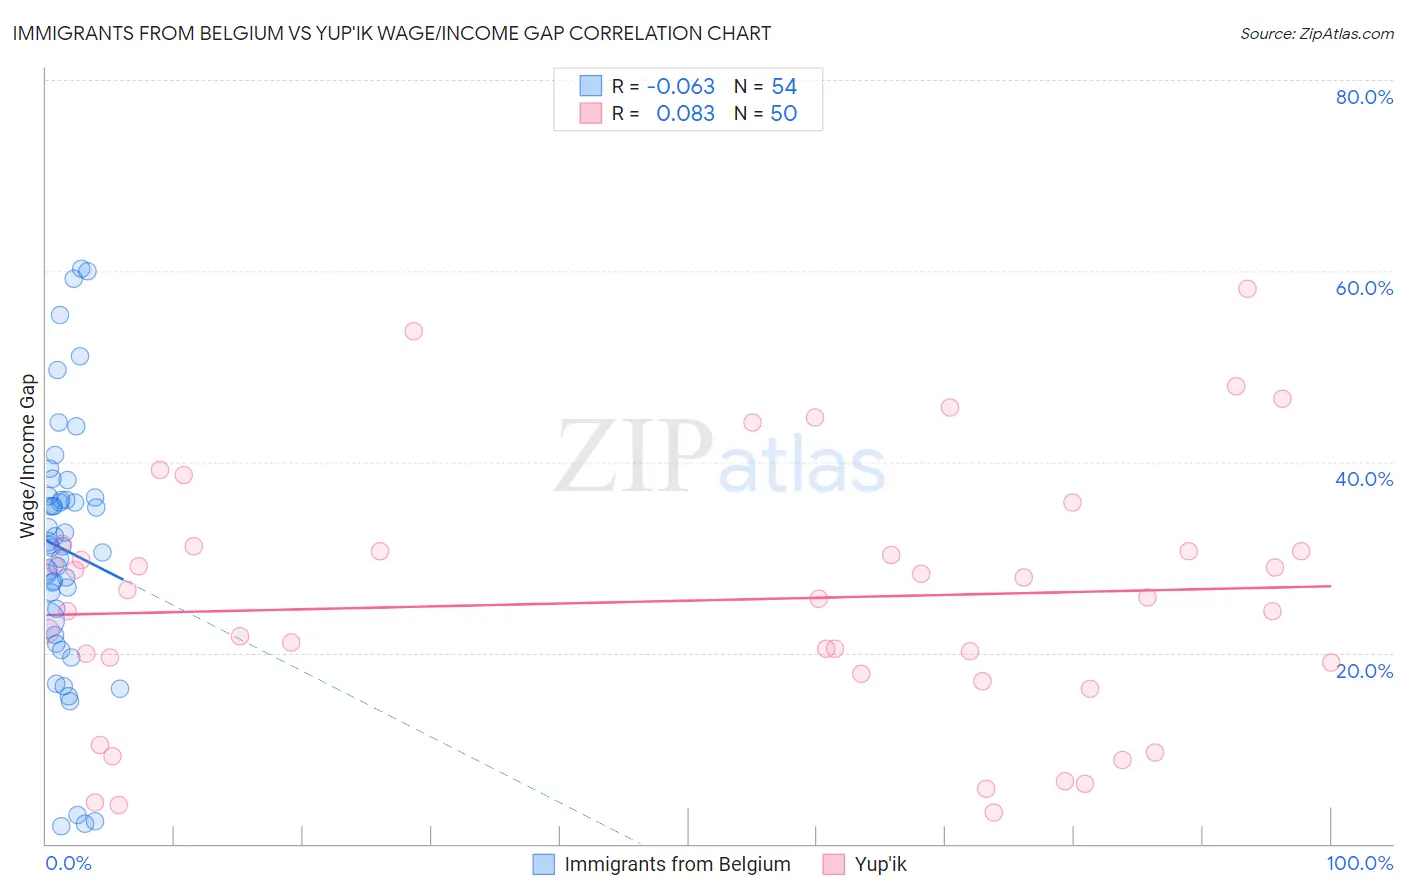
Immigrants from Belgium vs Yup'ik Wage/Income Gap Correlation Chart
The statistical analysis conducted on geographies consisting of 146,675,881 people shows a slight negative correlation between the proportion of Immigrants from Belgium and wage/income gap percentage in the United States with a correlation coefficient (R) of -0.063 and weighted average of 29.0%. Similarly, the statistical analysis conducted on geographies consisting of 39,932,187 people shows a slight positive correlation between the proportion of Yup'ik and wage/income gap percentage in the United States with a correlation coefficient (R) of 0.083 and weighted average of 24.7%, a difference of 17.8%.
Wage/Income Gap Correlation Summary
| Measurement | Immigrants from Belgium | Yup'ik |
| Minimum | 1.8% | 3.3% |
| Maximum | 60.2% | 58.1% |
| Range | 58.4% | 54.8% |
| Mean | 30.8% | 25.4% |
| Median | 31.2% | 25.7% |
| Interquartile 25% (IQ1) | 23.4% | 17.8% |
| Interquartile 75% (IQ3) | 36.3% | 30.6% |
| Interquartile Range (IQR) | 12.9% | 12.8% |
| Standard Deviation (Sample) | 13.5% | 13.3% |
| Standard Deviation (Population) | 13.4% | 13.1% |
Similar Demographics by Wage/Income Gap
Demographics Similar to Immigrants from Belgium by Wage/Income Gap
In terms of wage/income gap, the demographic groups most similar to Immigrants from Belgium are Hungarian (29.0%, a difference of 0.070%), Immigrants from Iran (29.1%, a difference of 0.11%), Scandinavian (29.1%, a difference of 0.17%), Croatian (29.0%, a difference of 0.20%), and Scottish (29.1%, a difference of 0.31%).
| Demographics | Rating | Rank | Wage/Income Gap |
| Slovaks | 0.1 /100 | #319 | Tragic 28.9% |
| British | 0.1 /100 | #320 | Tragic 28.9% |
| Welsh | 0.1 /100 | #321 | Tragic 28.9% |
| Immigrants | Singapore | 0.1 /100 | #322 | Tragic 28.9% |
| Norwegians | 0.1 /100 | #323 | Tragic 29.0% |
| Croatians | 0.0 /100 | #324 | Tragic 29.0% |
| Hungarians | 0.0 /100 | #325 | Tragic 29.0% |
| Immigrants | Belgium | 0.0 /100 | #326 | Tragic 29.0% |
| Immigrants | Iran | 0.0 /100 | #327 | Tragic 29.1% |
| Scandinavians | 0.0 /100 | #328 | Tragic 29.1% |
| Scottish | 0.0 /100 | #329 | Tragic 29.1% |
| Germans | 0.0 /100 | #330 | Tragic 29.2% |
| Czechs | 0.0 /100 | #331 | Tragic 29.2% |
| Immigrants | South Central Asia | 0.0 /100 | #332 | Tragic 29.3% |
| Europeans | 0.0 /100 | #333 | Tragic 29.4% |
Demographics Similar to Yup'ik by Wage/Income Gap
In terms of wage/income gap, the demographic groups most similar to Yup'ik are Alsatian (24.7%, a difference of 0.020%), Immigrants from Central America (24.6%, a difference of 0.050%), Immigrants from Philippines (24.7%, a difference of 0.090%), German Russian (24.6%, a difference of 0.12%), and Immigrants from Uruguay (24.6%, a difference of 0.13%).
| Demographics | Rating | Rank | Wage/Income Gap |
| Apache | 94.8 /100 | #122 | Exceptional 24.5% |
| Natives/Alaskans | 94.6 /100 | #123 | Exceptional 24.6% |
| Immigrants | South America | 93.9 /100 | #124 | Exceptional 24.6% |
| Spanish Americans | 93.8 /100 | #125 | Exceptional 24.6% |
| Immigrants | Uruguay | 93.8 /100 | #126 | Exceptional 24.6% |
| German Russians | 93.7 /100 | #127 | Exceptional 24.6% |
| Immigrants | Central America | 93.5 /100 | #128 | Exceptional 24.6% |
| Yup'ik | 93.3 /100 | #129 | Exceptional 24.7% |
| Alsatians | 93.2 /100 | #130 | Exceptional 24.7% |
| Immigrants | Philippines | 93.0 /100 | #131 | Exceptional 24.7% |
| Immigrants | Costa Rica | 92.4 /100 | #132 | Exceptional 24.7% |
| Colombians | 92.4 /100 | #133 | Exceptional 24.7% |
| Mexican American Indians | 92.2 /100 | #134 | Exceptional 24.7% |
| South American Indians | 92.0 /100 | #135 | Exceptional 24.7% |
| Armenians | 91.3 /100 | #136 | Exceptional 24.8% |