Immigrants from Belgium vs Filipino Per Capita Income
COMPARE
Immigrants from Belgium
Filipino
Per Capita Income
Per Capita Income Comparison
Immigrants from Belgium
Filipinos
$55,082
PER CAPITA INCOME
100.0/ 100
METRIC RATING
14th/ 347
METRIC RANK
$59,066
PER CAPITA INCOME
100.0/ 100
METRIC RATING
1st/ 347
METRIC RANK
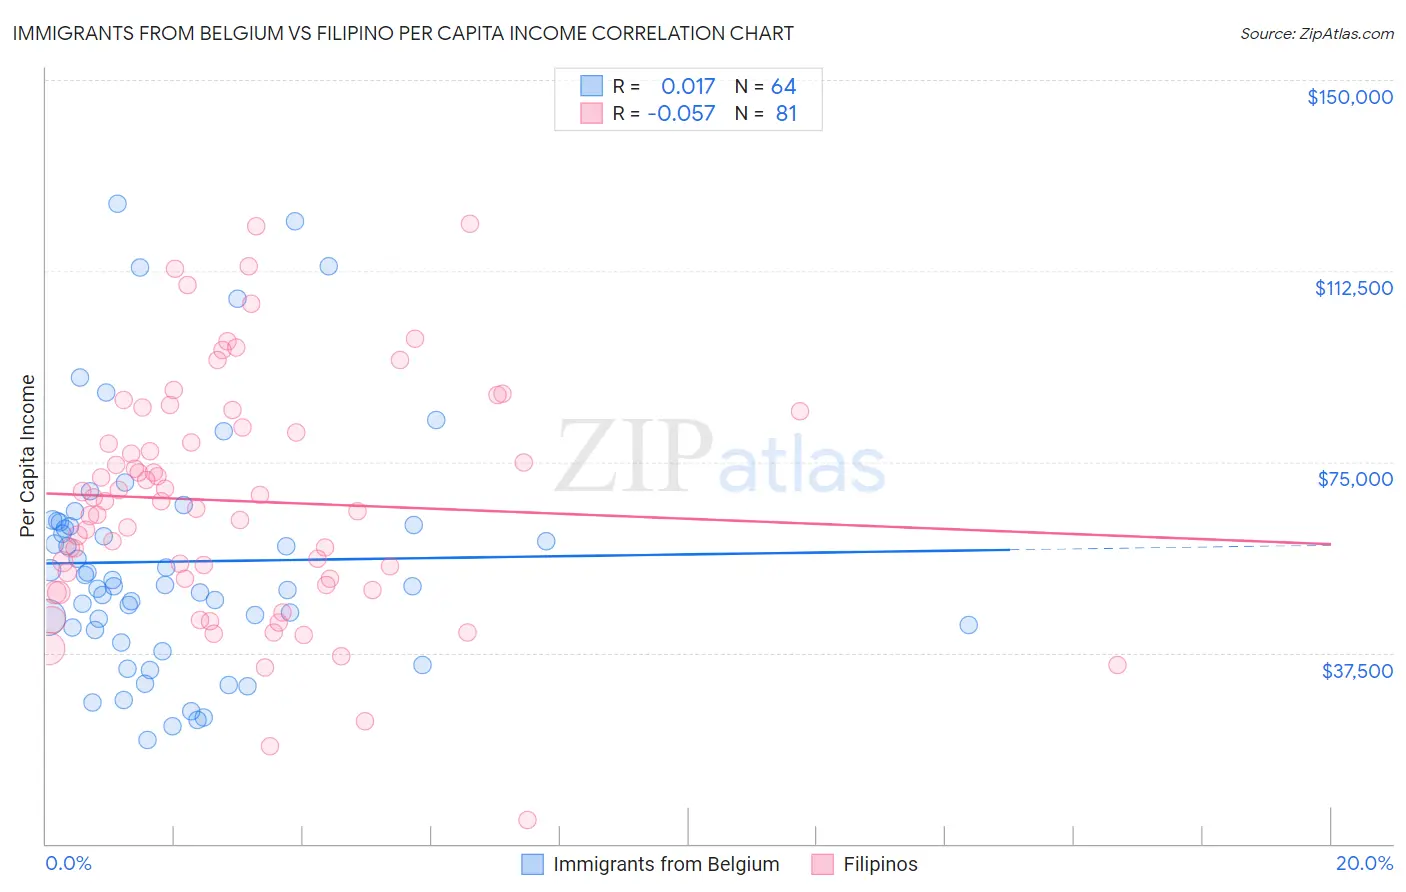
Immigrants from Belgium vs Filipino Per Capita Income Correlation Chart
The statistical analysis conducted on geographies consisting of 146,715,223 people shows no correlation between the proportion of Immigrants from Belgium and per capita income in the United States with a correlation coefficient (R) of 0.017 and weighted average of $55,082. Similarly, the statistical analysis conducted on geographies consisting of 254,359,894 people shows a slight negative correlation between the proportion of Filipinos and per capita income in the United States with a correlation coefficient (R) of -0.057 and weighted average of $59,066, a difference of 7.2%.
Per Capita Income Correlation Summary
| Measurement | Immigrants from Belgium | Filipino |
| Minimum | $20,313 | $4,657 |
| Maximum | $125,796 | $121,798 |
| Range | $105,483 | $117,141 |
| Mean | $55,426 | $67,314 |
| Median | $50,708 | $67,249 |
| Interquartile 25% (IQ1) | $42,261 | $51,364 |
| Interquartile 75% (IQ3) | $62,896 | $83,421 |
| Interquartile Range (IQR) | $20,635 | $32,057 |
| Standard Deviation (Sample) | $23,673 | $23,294 |
| Standard Deviation (Population) | $23,487 | $23,149 |
Demographics Similar to Immigrants from Belgium and Filipinos by Per Capita Income
In terms of per capita income, the demographic groups most similar to Immigrants from Belgium are Cypriot ($54,899, a difference of 0.33%), Immigrants from India ($55,268, a difference of 0.34%), Immigrants from Switzerland ($54,866, a difference of 0.39%), Immigrants from Sweden ($55,582, a difference of 0.91%), and Immigrants from France ($54,557, a difference of 0.96%). Similarly, the demographic groups most similar to Filipinos are Iranian ($58,786, a difference of 0.48%), Immigrants from Singapore ($58,353, a difference of 1.2%), Immigrants from Australia ($57,953, a difference of 1.9%), Immigrants from Iran ($57,759, a difference of 2.3%), and Immigrants from Taiwan ($57,742, a difference of 2.3%).
| Demographics | Rating | Rank | Per Capita Income |
| Filipinos | 100.0 /100 | #1 | Exceptional $59,066 |
| Iranians | 100.0 /100 | #2 | Exceptional $58,786 |
| Immigrants | Singapore | 100.0 /100 | #3 | Exceptional $58,353 |
| Immigrants | Australia | 100.0 /100 | #4 | Exceptional $57,953 |
| Immigrants | Iran | 100.0 /100 | #5 | Exceptional $57,759 |
| Immigrants | Taiwan | 100.0 /100 | #6 | Exceptional $57,742 |
| Immigrants | Israel | 100.0 /100 | #7 | Exceptional $57,384 |
| Immigrants | Hong Kong | 100.0 /100 | #8 | Exceptional $56,709 |
| Immigrants | Ireland | 100.0 /100 | #9 | Exceptional $56,584 |
| Okinawans | 100.0 /100 | #10 | Exceptional $55,817 |
| Eastern Europeans | 100.0 /100 | #11 | Exceptional $55,780 |
| Immigrants | Sweden | 100.0 /100 | #12 | Exceptional $55,582 |
| Immigrants | India | 100.0 /100 | #13 | Exceptional $55,268 |
| Immigrants | Belgium | 100.0 /100 | #14 | Exceptional $55,082 |
| Cypriots | 100.0 /100 | #15 | Exceptional $54,899 |
| Immigrants | Switzerland | 100.0 /100 | #16 | Exceptional $54,866 |
| Immigrants | France | 100.0 /100 | #17 | Exceptional $54,557 |
| Thais | 100.0 /100 | #18 | Exceptional $54,307 |
| Immigrants | China | 100.0 /100 | #19 | Exceptional $54,264 |
| Soviet Union | 100.0 /100 | #20 | Exceptional $54,202 |