Immigrants from Trinidad and Tobago vs Immigrants from Grenada Per Capita Income
COMPARE
Immigrants from Trinidad and Tobago
Immigrants from Grenada
Per Capita Income
Per Capita Income Comparison
Immigrants from Trinidad and Tobago
Immigrants from Grenada
$41,476
PER CAPITA INCOME
7.9/ 100
METRIC RATING
221st/ 347
METRIC RANK
$41,123
PER CAPITA INCOME
5.5/ 100
METRIC RATING
228th/ 347
METRIC RANK
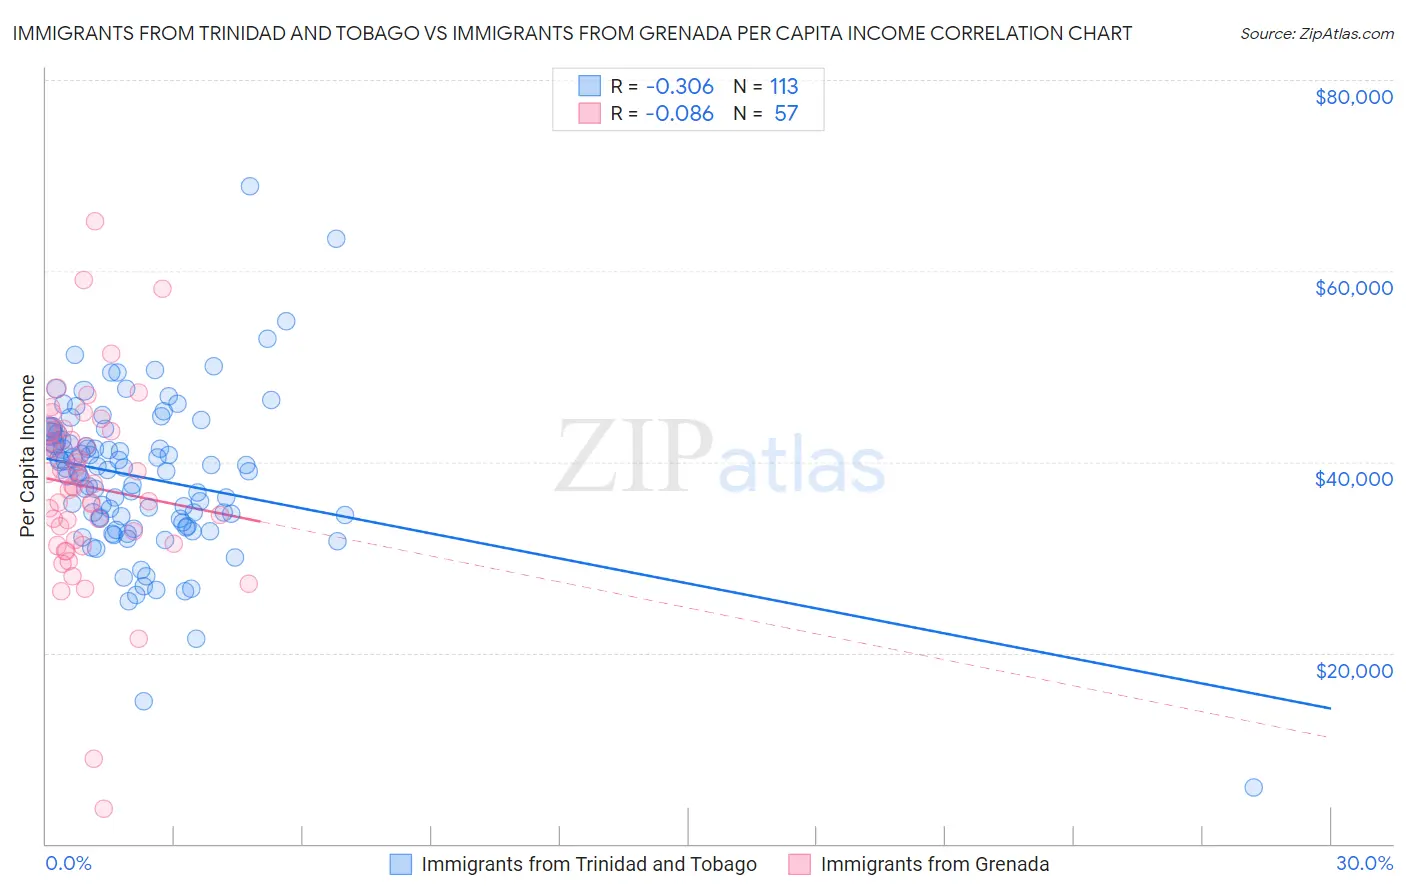
Immigrants from Trinidad and Tobago vs Immigrants from Grenada Per Capita Income Correlation Chart
The statistical analysis conducted on geographies consisting of 223,544,237 people shows a mild negative correlation between the proportion of Immigrants from Trinidad and Tobago and per capita income in the United States with a correlation coefficient (R) of -0.306 and weighted average of $41,476. Similarly, the statistical analysis conducted on geographies consisting of 67,200,351 people shows a slight negative correlation between the proportion of Immigrants from Grenada and per capita income in the United States with a correlation coefficient (R) of -0.086 and weighted average of $41,123, a difference of 0.86%.
Per Capita Income Correlation Summary
| Measurement | Immigrants from Trinidad and Tobago | Immigrants from Grenada |
| Minimum | $5,914 | $3,645 |
| Maximum | $68,888 | $65,209 |
| Range | $62,974 | $61,564 |
| Mean | $38,326 | $37,400 |
| Median | $38,965 | $37,479 |
| Interquartile 25% (IQ1) | $33,457 | $31,664 |
| Interquartile 75% (IQ3) | $42,576 | $43,240 |
| Interquartile Range (IQR) | $9,119 | $11,576 |
| Standard Deviation (Sample) | $8,310 | $10,138 |
| Standard Deviation (Population) | $8,273 | $10,049 |
Demographics Similar to Immigrants from Trinidad and Tobago and Immigrants from Grenada by Per Capita Income
In terms of per capita income, the demographic groups most similar to Immigrants from Trinidad and Tobago are Immigrants from Barbados ($41,478, a difference of 0.0%), Puget Sound Salish ($41,495, a difference of 0.040%), Immigrants from Iraq ($41,365, a difference of 0.27%), Immigrants from Cameroon ($41,334, a difference of 0.34%), and Trinidadian and Tobagonian ($41,655, a difference of 0.43%). Similarly, the demographic groups most similar to Immigrants from Grenada are Immigrants from Ghana ($41,131, a difference of 0.020%), Immigrants from Ecuador ($41,195, a difference of 0.17%), West Indian ($41,217, a difference of 0.23%), Nigerian ($41,026, a difference of 0.24%), and Native Hawaiian ($41,017, a difference of 0.26%).
| Demographics | Rating | Rank | Per Capita Income |
| Immigrants | Bangladesh | 10.1 /100 | #214 | Poor $41,709 |
| Sudanese | 9.9 /100 | #215 | Tragic $41,695 |
| Tongans | 9.9 /100 | #216 | Tragic $41,693 |
| Guamanians/Chamorros | 9.7 /100 | #217 | Tragic $41,678 |
| Trinidadians and Tobagonians | 9.5 /100 | #218 | Tragic $41,655 |
| Puget Sound Salish | 8.1 /100 | #219 | Tragic $41,495 |
| Immigrants | Barbados | 7.9 /100 | #220 | Tragic $41,478 |
| Immigrants | Trinidad and Tobago | 7.9 /100 | #221 | Tragic $41,476 |
| Immigrants | Iraq | 7.1 /100 | #222 | Tragic $41,365 |
| Immigrants | Cameroon | 6.8 /100 | #223 | Tragic $41,334 |
| Immigrants | St. Vincent and the Grenadines | 6.4 /100 | #224 | Tragic $41,270 |
| West Indians | 6.0 /100 | #225 | Tragic $41,217 |
| Immigrants | Ecuador | 5.9 /100 | #226 | Tragic $41,195 |
| Immigrants | Ghana | 5.5 /100 | #227 | Tragic $41,131 |
| Immigrants | Grenada | 5.5 /100 | #228 | Tragic $41,123 |
| Nigerians | 4.9 /100 | #229 | Tragic $41,026 |
| Native Hawaiians | 4.9 /100 | #230 | Tragic $41,017 |
| Senegalese | 4.8 /100 | #231 | Tragic $41,000 |
| Guyanese | 4.5 /100 | #232 | Tragic $40,949 |
| Delaware | 3.8 /100 | #233 | Tragic $40,778 |
| Immigrants | West Indies | 3.7 /100 | #234 | Tragic $40,763 |