Puerto Rican vs Immigrants from Grenada Per Capita Income
COMPARE
Puerto Rican
Immigrants from Grenada
Per Capita Income
Per Capita Income Comparison
Puerto Ricans
Immigrants from Grenada
$31,268
PER CAPITA INCOME
0.0/ 100
METRIC RATING
341st/ 347
METRIC RANK
$41,123
PER CAPITA INCOME
5.5/ 100
METRIC RATING
228th/ 347
METRIC RANK
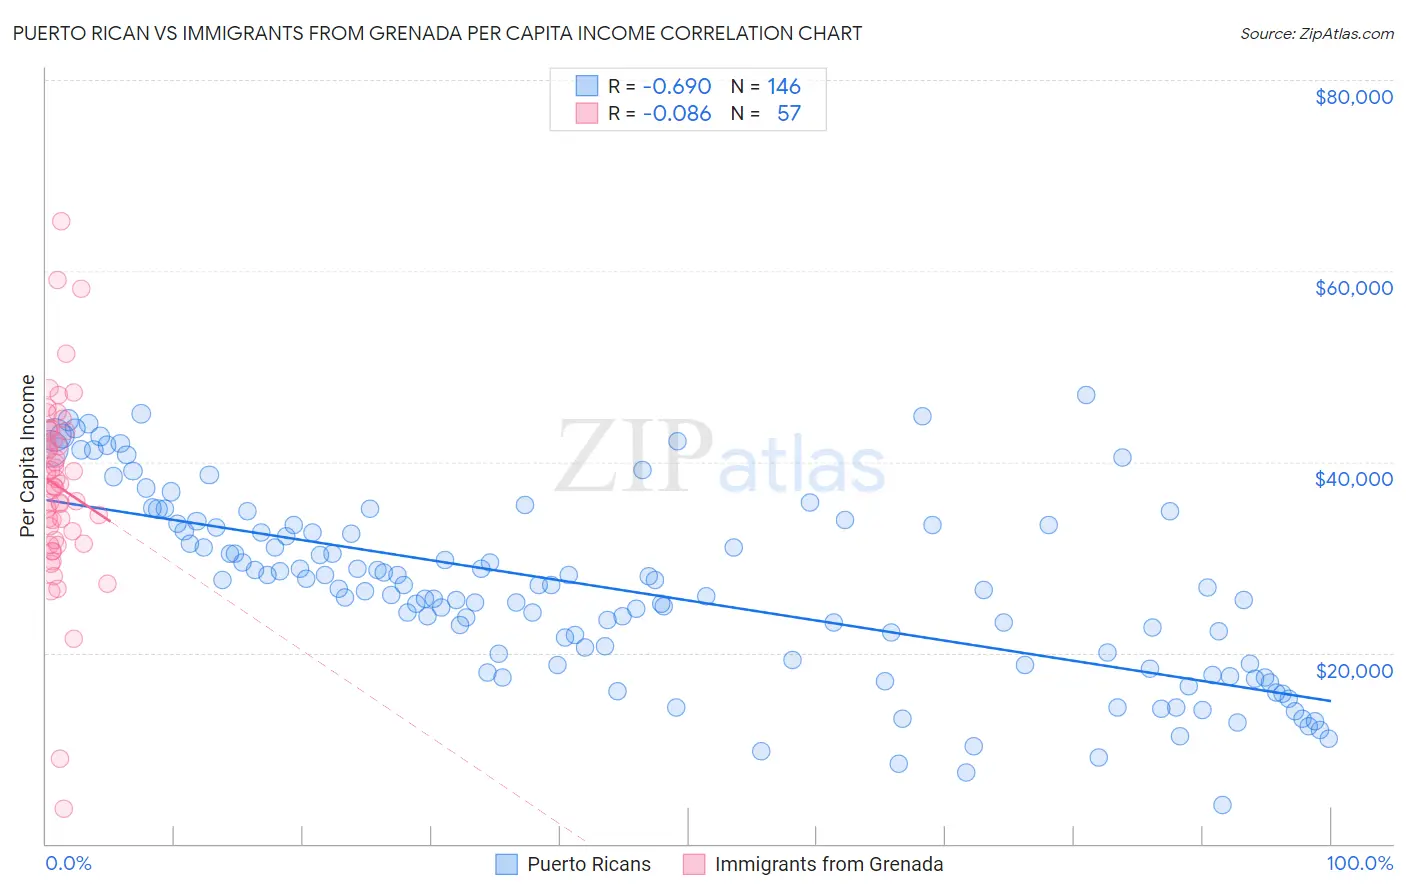
Puerto Rican vs Immigrants from Grenada Per Capita Income Correlation Chart
The statistical analysis conducted on geographies consisting of 528,362,553 people shows a significant negative correlation between the proportion of Puerto Ricans and per capita income in the United States with a correlation coefficient (R) of -0.690 and weighted average of $31,268. Similarly, the statistical analysis conducted on geographies consisting of 67,200,351 people shows a slight negative correlation between the proportion of Immigrants from Grenada and per capita income in the United States with a correlation coefficient (R) of -0.086 and weighted average of $41,123, a difference of 31.5%.
Per Capita Income Correlation Summary
| Measurement | Puerto Rican | Immigrants from Grenada |
| Minimum | $4,085 | $3,645 |
| Maximum | $46,990 | $65,209 |
| Range | $42,905 | $61,564 |
| Mean | $26,618 | $37,400 |
| Median | $26,784 | $37,479 |
| Interquartile 25% (IQ1) | $18,902 | $31,664 |
| Interquartile 75% (IQ3) | $33,347 | $43,240 |
| Interquartile Range (IQR) | $14,444 | $11,576 |
| Standard Deviation (Sample) | $9,544 | $10,138 |
| Standard Deviation (Population) | $9,511 | $10,049 |
Similar Demographics by Per Capita Income
Demographics Similar to Puerto Ricans by Per Capita Income
In terms of per capita income, the demographic groups most similar to Puerto Ricans are Hopi ($31,177, a difference of 0.29%), Crow ($31,729, a difference of 1.5%), Pima ($30,644, a difference of 2.0%), Pueblo ($32,012, a difference of 2.4%), and Yup'ik ($30,518, a difference of 2.5%).
| Demographics | Rating | Rank | Per Capita Income |
| Immigrants | Yemen | 0.0 /100 | #333 | Tragic $33,696 |
| Natives/Alaskans | 0.0 /100 | #334 | Tragic $33,279 |
| Yuman | 0.0 /100 | #335 | Tragic $33,236 |
| Yakama | 0.0 /100 | #336 | Tragic $33,009 |
| Houma | 0.0 /100 | #337 | Tragic $32,996 |
| Arapaho | 0.0 /100 | #338 | Tragic $32,345 |
| Pueblo | 0.0 /100 | #339 | Tragic $32,012 |
| Crow | 0.0 /100 | #340 | Tragic $31,729 |
| Puerto Ricans | 0.0 /100 | #341 | Tragic $31,268 |
| Hopi | 0.0 /100 | #342 | Tragic $31,177 |
| Pima | 0.0 /100 | #343 | Tragic $30,644 |
| Yup'ik | 0.0 /100 | #344 | Tragic $30,518 |
| Tohono O'odham | 0.0 /100 | #345 | Tragic $30,256 |
| Lumbee | 0.0 /100 | #346 | Tragic $29,845 |
| Navajo | 0.0 /100 | #347 | Tragic $29,031 |
Demographics Similar to Immigrants from Grenada by Per Capita Income
In terms of per capita income, the demographic groups most similar to Immigrants from Grenada are Immigrants from Ghana ($41,131, a difference of 0.020%), Immigrants from Ecuador ($41,195, a difference of 0.17%), West Indian ($41,217, a difference of 0.23%), Nigerian ($41,026, a difference of 0.24%), and Native Hawaiian ($41,017, a difference of 0.26%).
| Demographics | Rating | Rank | Per Capita Income |
| Immigrants | Trinidad and Tobago | 7.9 /100 | #221 | Tragic $41,476 |
| Immigrants | Iraq | 7.1 /100 | #222 | Tragic $41,365 |
| Immigrants | Cameroon | 6.8 /100 | #223 | Tragic $41,334 |
| Immigrants | St. Vincent and the Grenadines | 6.4 /100 | #224 | Tragic $41,270 |
| West Indians | 6.0 /100 | #225 | Tragic $41,217 |
| Immigrants | Ecuador | 5.9 /100 | #226 | Tragic $41,195 |
| Immigrants | Ghana | 5.5 /100 | #227 | Tragic $41,131 |
| Immigrants | Grenada | 5.5 /100 | #228 | Tragic $41,123 |
| Nigerians | 4.9 /100 | #229 | Tragic $41,026 |
| Native Hawaiians | 4.9 /100 | #230 | Tragic $41,017 |
| Senegalese | 4.8 /100 | #231 | Tragic $41,000 |
| Guyanese | 4.5 /100 | #232 | Tragic $40,949 |
| Delaware | 3.8 /100 | #233 | Tragic $40,778 |
| Immigrants | West Indies | 3.7 /100 | #234 | Tragic $40,763 |
| Immigrants | Guyana | 3.6 /100 | #235 | Tragic $40,742 |