Immigrants from Barbados vs Italian Median Family Income
COMPARE
Immigrants from Barbados
Italian
Median Family Income
Median Family Income Comparison
Immigrants from Barbados
Italians
$92,419
MEDIAN FAMILY INCOME
0.5/ 100
METRIC RATING
254th/ 347
METRIC RANK
$112,372
MEDIAN FAMILY INCOME
99.3/ 100
METRIC RATING
79th/ 347
METRIC RANK
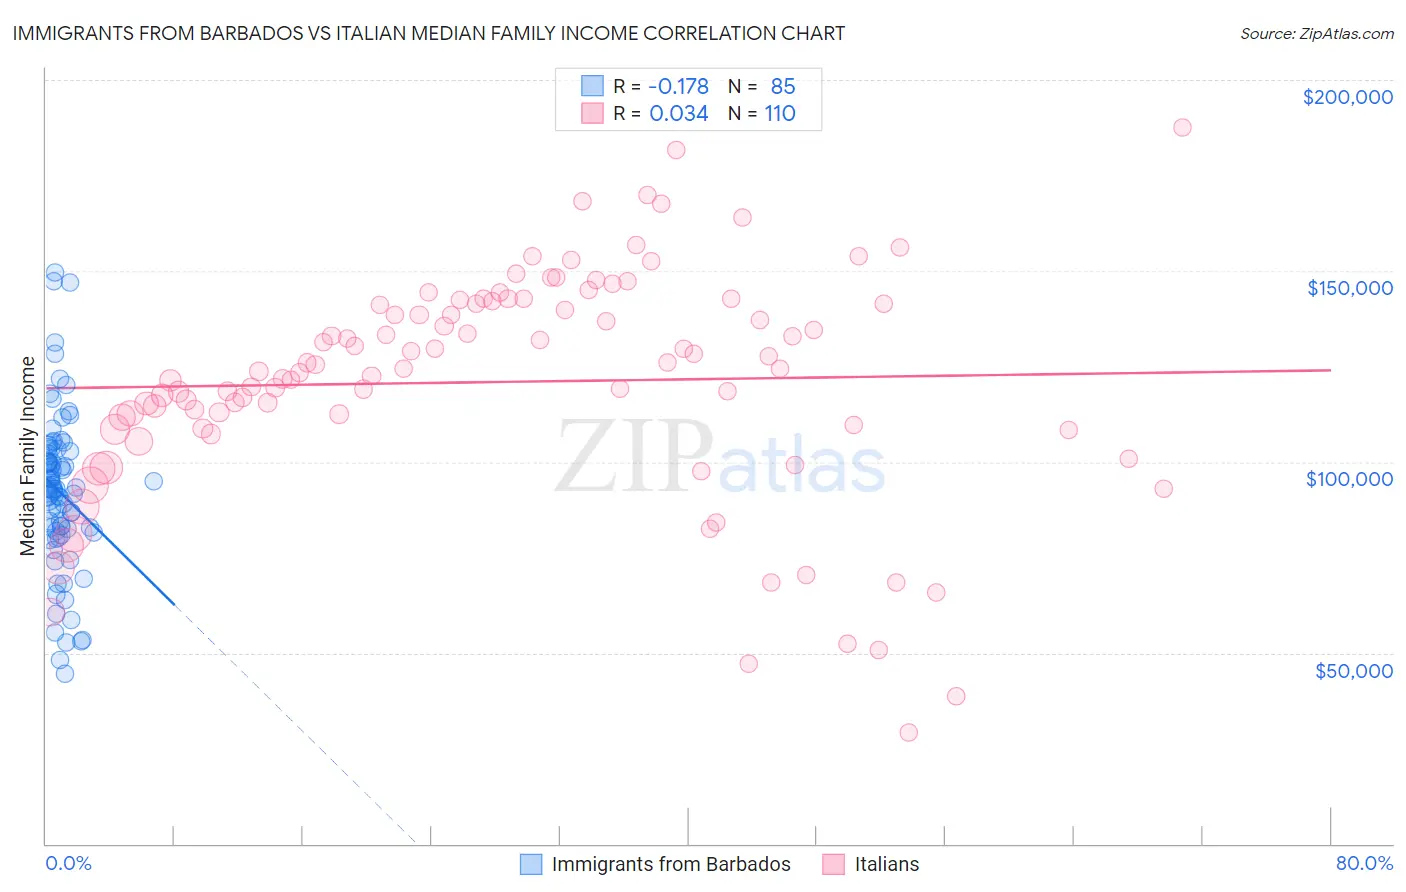
Immigrants from Barbados vs Italian Median Family Income Correlation Chart
The statistical analysis conducted on geographies consisting of 112,740,718 people shows a poor negative correlation between the proportion of Immigrants from Barbados and median family income in the United States with a correlation coefficient (R) of -0.178 and weighted average of $92,419. Similarly, the statistical analysis conducted on geographies consisting of 573,577,763 people shows no correlation between the proportion of Italians and median family income in the United States with a correlation coefficient (R) of 0.034 and weighted average of $112,372, a difference of 21.6%.
Median Family Income Correlation Summary
| Measurement | Immigrants from Barbados | Italian |
| Minimum | $44,554 | $29,018 |
| Maximum | $149,653 | $187,652 |
| Range | $105,099 | $158,634 |
| Mean | $92,071 | $120,937 |
| Median | $92,856 | $124,369 |
| Interquartile 25% (IQ1) | $81,708 | $108,740 |
| Interquartile 75% (IQ3) | $103,000 | $141,554 |
| Interquartile Range (IQR) | $21,293 | $32,814 |
| Standard Deviation (Sample) | $20,843 | $29,913 |
| Standard Deviation (Population) | $20,721 | $29,777 |
Similar Demographics by Median Family Income
Demographics Similar to Immigrants from Barbados by Median Family Income
In terms of median family income, the demographic groups most similar to Immigrants from Barbados are Immigrants from Guyana ($92,513, a difference of 0.10%), Immigrants from El Salvador ($92,545, a difference of 0.14%), Immigrants from Laos ($92,239, a difference of 0.20%), Nicaraguan ($92,231, a difference of 0.20%), and Immigrants from Somalia ($92,609, a difference of 0.21%).
| Demographics | Rating | Rank | Median Family Income |
| Immigrants | Senegal | 0.7 /100 | #247 | Tragic $92,912 |
| French American Indians | 0.7 /100 | #248 | Tragic $92,872 |
| Immigrants | Ecuador | 0.7 /100 | #249 | Tragic $92,837 |
| West Indians | 0.6 /100 | #250 | Tragic $92,765 |
| Immigrants | Somalia | 0.6 /100 | #251 | Tragic $92,609 |
| Immigrants | El Salvador | 0.6 /100 | #252 | Tragic $92,545 |
| Immigrants | Guyana | 0.6 /100 | #253 | Tragic $92,513 |
| Immigrants | Barbados | 0.5 /100 | #254 | Tragic $92,419 |
| Immigrants | Laos | 0.5 /100 | #255 | Tragic $92,239 |
| Nicaraguans | 0.5 /100 | #256 | Tragic $92,231 |
| Americans | 0.4 /100 | #257 | Tragic $92,096 |
| Osage | 0.4 /100 | #258 | Tragic $91,926 |
| Cape Verdeans | 0.4 /100 | #259 | Tragic $91,848 |
| Pennsylvania Germans | 0.4 /100 | #260 | Tragic $91,763 |
| Inupiat | 0.4 /100 | #261 | Tragic $91,730 |
Demographics Similar to Italians by Median Family Income
In terms of median family income, the demographic groups most similar to Italians are Immigrants from Canada ($112,374, a difference of 0.0%), Immigrants from Croatia ($112,323, a difference of 0.040%), Immigrants from Eastern Europe ($112,527, a difference of 0.14%), Immigrants from North America ($112,151, a difference of 0.20%), and Argentinean ($112,665, a difference of 0.26%).
| Demographics | Rating | Rank | Median Family Income |
| Afghans | 99.5 /100 | #72 | Exceptional $112,971 |
| Laotians | 99.5 /100 | #73 | Exceptional $112,859 |
| Immigrants | Italy | 99.4 /100 | #74 | Exceptional $112,848 |
| Immigrants | Western Europe | 99.4 /100 | #75 | Exceptional $112,688 |
| Argentineans | 99.4 /100 | #76 | Exceptional $112,665 |
| Immigrants | Eastern Europe | 99.4 /100 | #77 | Exceptional $112,527 |
| Immigrants | Canada | 99.3 /100 | #78 | Exceptional $112,374 |
| Italians | 99.3 /100 | #79 | Exceptional $112,372 |
| Immigrants | Croatia | 99.3 /100 | #80 | Exceptional $112,323 |
| Immigrants | North America | 99.2 /100 | #81 | Exceptional $112,151 |
| Immigrants | England | 99.2 /100 | #82 | Exceptional $112,038 |
| Immigrants | Egypt | 99.0 /100 | #83 | Exceptional $111,689 |
| Immigrants | Hungary | 98.8 /100 | #84 | Exceptional $111,378 |
| Croatians | 98.8 /100 | #85 | Exceptional $111,370 |
| Ukrainians | 98.8 /100 | #86 | Exceptional $111,368 |