Immigrants from Barbados vs Albanian Householder Income Ages 25 - 44 years
COMPARE
Immigrants from Barbados
Albanian
Householder Income Ages 25 - 44 years
Householder Income Ages 25 - 44 years Comparison
Immigrants from Barbados
Albanians
$88,687
HOUSEHOLDER INCOME AGES 25 - 44 YEARS
3.7/ 100
METRIC RATING
229th/ 347
METRIC RANK
$101,367
HOUSEHOLDER INCOME AGES 25 - 44 YEARS
97.8/ 100
METRIC RATING
101st/ 347
METRIC RANK
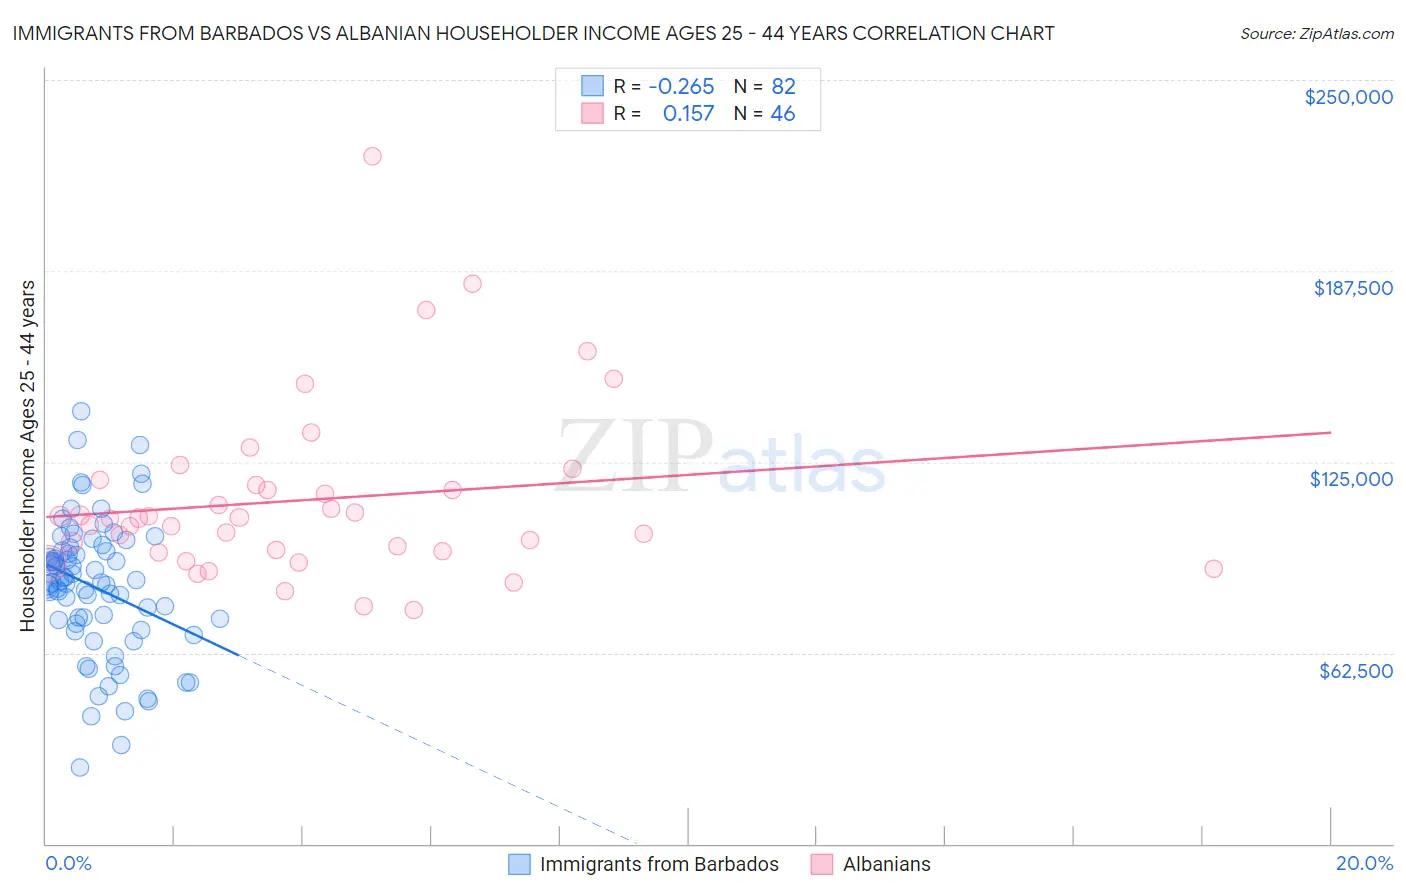
Immigrants from Barbados vs Albanian Householder Income Ages 25 - 44 years Correlation Chart
The statistical analysis conducted on geographies consisting of 112,714,156 people shows a weak negative correlation between the proportion of Immigrants from Barbados and household income with householder between the ages 25 and 44 in the United States with a correlation coefficient (R) of -0.265 and weighted average of $88,687. Similarly, the statistical analysis conducted on geographies consisting of 193,076,288 people shows a poor positive correlation between the proportion of Albanians and household income with householder between the ages 25 and 44 in the United States with a correlation coefficient (R) of 0.157 and weighted average of $101,367, a difference of 14.3%.
Householder Income Ages 25 - 44 years Correlation Summary
| Measurement | Immigrants from Barbados | Albanian |
| Minimum | $24,836 | $76,718 |
| Maximum | $141,528 | $225,000 |
| Range | $116,692 | $148,282 |
| Mean | $83,858 | $112,576 |
| Median | $85,381 | $106,494 |
| Interquartile 25% (IQ1) | $72,198 | $95,901 |
| Interquartile 75% (IQ3) | $95,727 | $117,313 |
| Interquartile Range (IQR) | $23,529 | $21,412 |
| Standard Deviation (Sample) | $22,403 | $28,766 |
| Standard Deviation (Population) | $22,266 | $28,452 |
Similar Demographics by Householder Income Ages 25 - 44 years
Demographics Similar to Immigrants from Barbados by Householder Income Ages 25 - 44 years
In terms of householder income ages 25 - 44 years, the demographic groups most similar to Immigrants from Barbados are Immigrants from Bosnia and Herzegovina ($88,819, a difference of 0.15%), Immigrants from St. Vincent and the Grenadines ($88,888, a difference of 0.23%), Alaskan Athabascan ($88,446, a difference of 0.27%), Immigrants from Grenada ($88,311, a difference of 0.43%), and Nonimmigrants ($88,301, a difference of 0.44%).
| Demographics | Rating | Rank | Householder Income Ages 25 - 44 years |
| Immigrants | Ecuador | 6.2 /100 | #222 | Tragic $89,673 |
| Immigrants | Guyana | 5.9 /100 | #223 | Tragic $89,586 |
| Barbadians | 5.9 /100 | #224 | Tragic $89,565 |
| Immigrants | Panama | 5.5 /100 | #225 | Tragic $89,451 |
| Immigrants | Iraq | 5.5 /100 | #226 | Tragic $89,444 |
| Immigrants | St. Vincent and the Grenadines | 4.1 /100 | #227 | Tragic $88,888 |
| Immigrants | Bosnia and Herzegovina | 4.0 /100 | #228 | Tragic $88,819 |
| Immigrants | Barbados | 3.7 /100 | #229 | Tragic $88,687 |
| Alaskan Athabascans | 3.3 /100 | #230 | Tragic $88,446 |
| Immigrants | Grenada | 3.0 /100 | #231 | Tragic $88,311 |
| Immigrants | Nonimmigrants | 3.0 /100 | #232 | Tragic $88,301 |
| Malaysians | 3.0 /100 | #233 | Tragic $88,291 |
| Venezuelans | 2.9 /100 | #234 | Tragic $88,232 |
| Bermudans | 2.9 /100 | #235 | Tragic $88,231 |
| Immigrants | Cameroon | 2.9 /100 | #236 | Tragic $88,214 |
Demographics Similar to Albanians by Householder Income Ages 25 - 44 years
In terms of householder income ages 25 - 44 years, the demographic groups most similar to Albanians are Immigrants from Argentina ($101,415, a difference of 0.050%), Taiwanese ($101,492, a difference of 0.12%), Immigrants from Lebanon ($101,124, a difference of 0.24%), Immigrants from Moldova ($101,091, a difference of 0.27%), and Immigrants from Poland ($101,065, a difference of 0.30%).
| Demographics | Rating | Rank | Householder Income Ages 25 - 44 years |
| Sri Lankans | 98.4 /100 | #94 | Exceptional $101,960 |
| Assyrians/Chaldeans/Syriacs | 98.3 /100 | #95 | Exceptional $101,936 |
| Macedonians | 98.3 /100 | #96 | Exceptional $101,882 |
| Austrians | 98.3 /100 | #97 | Exceptional $101,842 |
| Immigrants | Kazakhstan | 98.1 /100 | #98 | Exceptional $101,727 |
| Taiwanese | 97.9 /100 | #99 | Exceptional $101,492 |
| Immigrants | Argentina | 97.8 /100 | #100 | Exceptional $101,415 |
| Albanians | 97.8 /100 | #101 | Exceptional $101,367 |
| Immigrants | Lebanon | 97.4 /100 | #102 | Exceptional $101,124 |
| Immigrants | Moldova | 97.4 /100 | #103 | Exceptional $101,091 |
| Immigrants | Poland | 97.4 /100 | #104 | Exceptional $101,065 |
| Immigrants | Vietnam | 96.5 /100 | #105 | Exceptional $100,535 |
| Immigrants | Brazil | 96.5 /100 | #106 | Exceptional $100,534 |
| Northern Europeans | 96.3 /100 | #107 | Exceptional $100,457 |
| Immigrants | South Eastern Asia | 96.0 /100 | #108 | Exceptional $100,283 |