Immigrants from Barbados vs British Median Household Income
COMPARE
Immigrants from Barbados
British
Median Household Income
Median Household Income Comparison
Immigrants from Barbados
British
$78,989
MEDIAN HOUSEHOLD INCOME
1.9/ 100
METRIC RATING
243rd/ 347
METRIC RANK
$88,914
MEDIAN HOUSEHOLD INCOME
92.0/ 100
METRIC RATING
130th/ 347
METRIC RANK
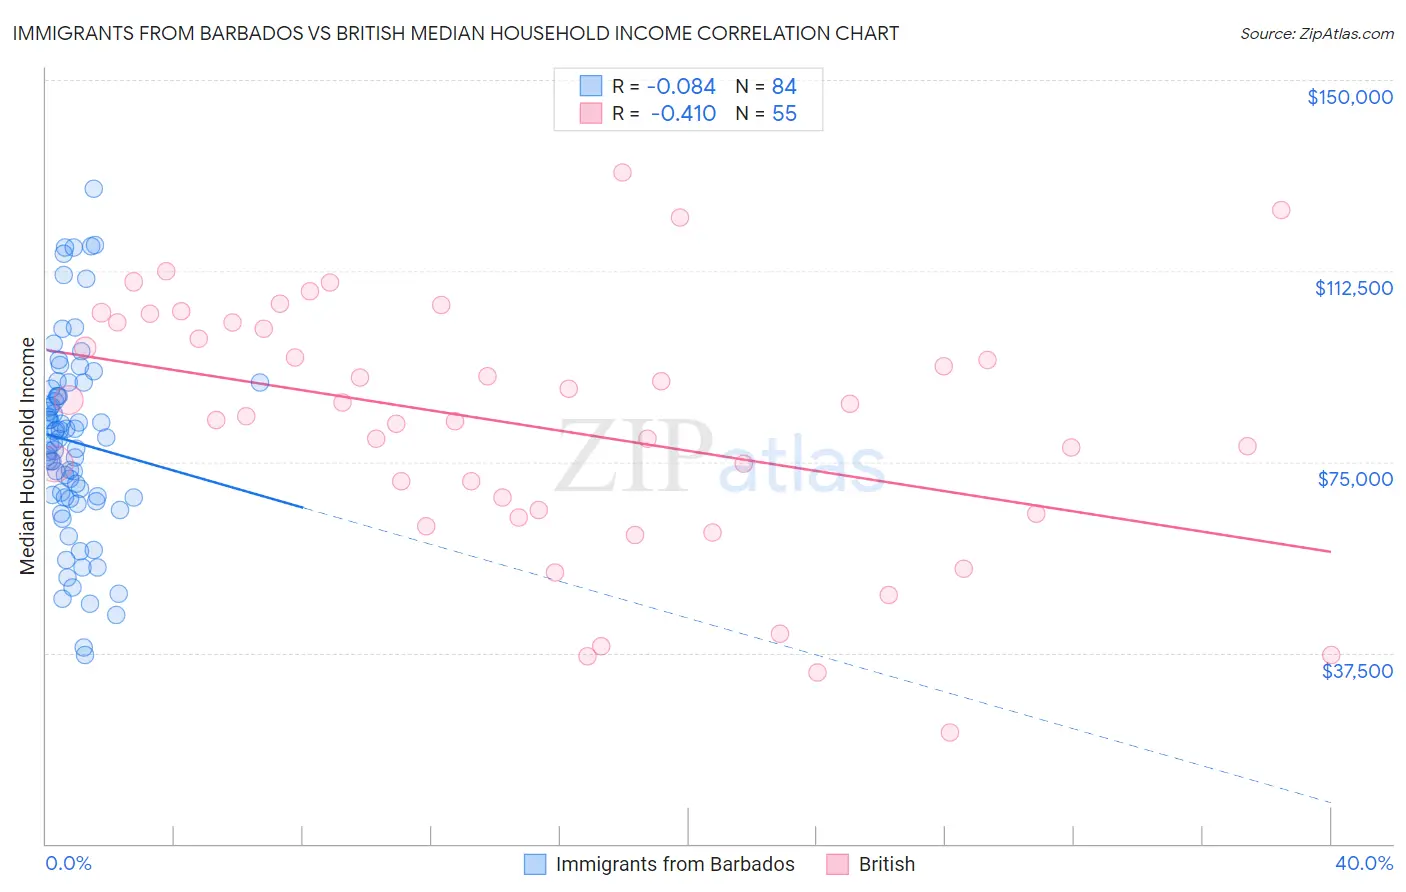
Immigrants from Barbados vs British Median Household Income Correlation Chart
The statistical analysis conducted on geographies consisting of 112,738,981 people shows a slight negative correlation between the proportion of Immigrants from Barbados and median household income in the United States with a correlation coefficient (R) of -0.084 and weighted average of $78,989. Similarly, the statistical analysis conducted on geographies consisting of 530,799,157 people shows a moderate negative correlation between the proportion of British and median household income in the United States with a correlation coefficient (R) of -0.410 and weighted average of $88,914, a difference of 12.6%.
Median Household Income Correlation Summary
| Measurement | Immigrants from Barbados | British |
| Minimum | $37,105 | $21,968 |
| Maximum | $128,750 | $131,817 |
| Range | $91,645 | $109,849 |
| Mean | $78,963 | $81,960 |
| Median | $79,093 | $83,896 |
| Interquartile 25% (IQ1) | $67,974 | $64,868 |
| Interquartile 75% (IQ3) | $88,607 | $102,423 |
| Interquartile Range (IQR) | $20,633 | $37,555 |
| Standard Deviation (Sample) | $18,879 | $24,875 |
| Standard Deviation (Population) | $18,767 | $24,648 |
Similar Demographics by Median Household Income
Demographics Similar to Immigrants from Barbados by Median Household Income
In terms of median household income, the demographic groups most similar to Immigrants from Barbados are Marshallese ($78,930, a difference of 0.080%), Immigrants from Sudan ($79,103, a difference of 0.14%), Inupiat ($78,841, a difference of 0.19%), Central American ($78,803, a difference of 0.24%), and Immigrants from Burma/Myanmar ($78,682, a difference of 0.39%).
| Demographics | Rating | Rank | Median Household Income |
| Immigrants | Bosnia and Herzegovina | 3.4 /100 | #236 | Tragic $79,888 |
| Nicaraguans | 3.1 /100 | #237 | Tragic $79,737 |
| Barbadians | 3.0 /100 | #238 | Tragic $79,664 |
| Alaska Natives | 2.7 /100 | #239 | Tragic $79,509 |
| Immigrants | Western Africa | 2.7 /100 | #240 | Tragic $79,490 |
| Immigrants | Nonimmigrants | 2.6 /100 | #241 | Tragic $79,429 |
| Immigrants | Sudan | 2.1 /100 | #242 | Tragic $79,103 |
| Immigrants | Barbados | 1.9 /100 | #243 | Tragic $78,989 |
| Marshallese | 1.9 /100 | #244 | Tragic $78,930 |
| Inupiat | 1.8 /100 | #245 | Tragic $78,841 |
| Central Americans | 1.7 /100 | #246 | Tragic $78,803 |
| Immigrants | Burma/Myanmar | 1.6 /100 | #247 | Tragic $78,682 |
| Sudanese | 1.5 /100 | #248 | Tragic $78,529 |
| West Indians | 1.4 /100 | #249 | Tragic $78,455 |
| Immigrants | Laos | 1.3 /100 | #250 | Tragic $78,327 |
Demographics Similar to British by Median Household Income
In terms of median household income, the demographic groups most similar to British are Brazilian ($88,934, a difference of 0.020%), Portuguese ($88,976, a difference of 0.070%), Immigrants from Peru ($89,010, a difference of 0.11%), Immigrants from Syria ($88,792, a difference of 0.14%), and European ($88,751, a difference of 0.18%).
| Demographics | Rating | Rank | Median Household Income |
| Immigrants | Zimbabwe | 94.4 /100 | #123 | Exceptional $89,496 |
| Immigrants | Jordan | 94.1 /100 | #124 | Exceptional $89,412 |
| Immigrants | Kuwait | 93.5 /100 | #125 | Exceptional $89,263 |
| Immigrants | Oceania | 92.9 /100 | #126 | Exceptional $89,100 |
| Immigrants | Peru | 92.5 /100 | #127 | Exceptional $89,010 |
| Portuguese | 92.3 /100 | #128 | Exceptional $88,976 |
| Brazilians | 92.1 /100 | #129 | Exceptional $88,934 |
| British | 92.0 /100 | #130 | Exceptional $88,914 |
| Immigrants | Syria | 91.4 /100 | #131 | Exceptional $88,792 |
| Europeans | 91.2 /100 | #132 | Exceptional $88,751 |
| Immigrants | Ethiopia | 90.9 /100 | #133 | Exceptional $88,687 |
| Swedes | 90.0 /100 | #134 | Exceptional $88,524 |
| Immigrants | Sierra Leone | 89.9 /100 | #135 | Excellent $88,498 |
| Poles | 89.7 /100 | #136 | Excellent $88,472 |
| Sierra Leoneans | 89.6 /100 | #137 | Excellent $88,463 |