Immigrants from Austria vs Guamanian/Chamorro Median Household Income
COMPARE
Immigrants from Austria
Guamanian/Chamorro
Median Household Income
Median Household Income Comparison
Immigrants from Austria
Guamanians/Chamorros
$95,277
MEDIAN HOUSEHOLD INCOME
99.9/ 100
METRIC RATING
56th/ 347
METRIC RANK
$86,255
MEDIAN HOUSEHOLD INCOME
67.7/ 100
METRIC RATING
162nd/ 347
METRIC RANK
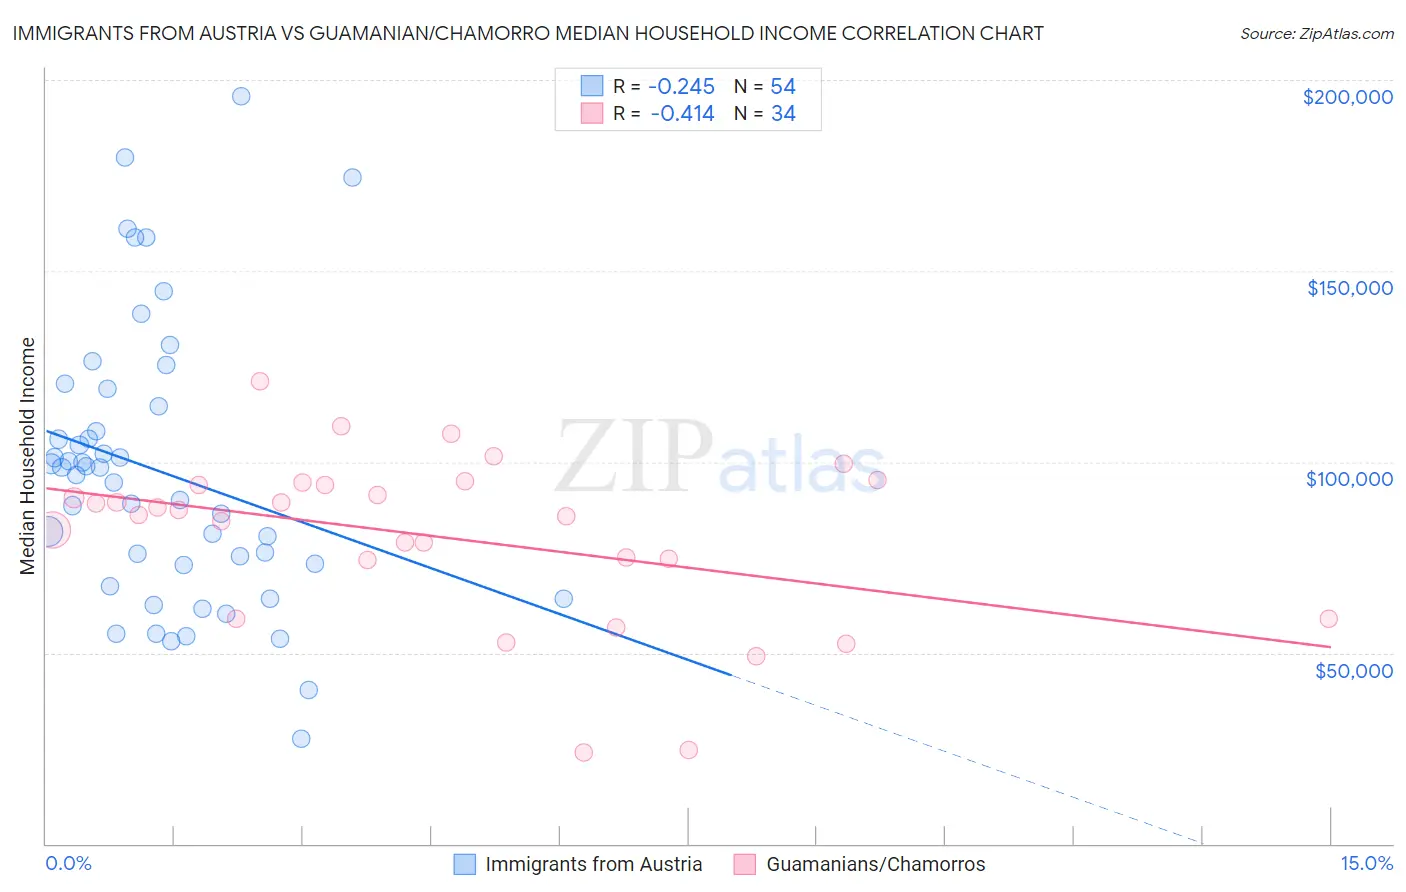
Immigrants from Austria vs Guamanian/Chamorro Median Household Income Correlation Chart
The statistical analysis conducted on geographies consisting of 167,955,679 people shows a weak negative correlation between the proportion of Immigrants from Austria and median household income in the United States with a correlation coefficient (R) of -0.245 and weighted average of $95,277. Similarly, the statistical analysis conducted on geographies consisting of 221,863,113 people shows a moderate negative correlation between the proportion of Guamanians/Chamorros and median household income in the United States with a correlation coefficient (R) of -0.414 and weighted average of $86,255, a difference of 10.5%.
Median Household Income Correlation Summary
| Measurement | Immigrants from Austria | Guamanian/Chamorro |
| Minimum | $27,500 | $23,750 |
| Maximum | $195,784 | $121,240 |
| Range | $168,284 | $97,490 |
| Mean | $97,293 | $80,405 |
| Median | $97,556 | $86,640 |
| Interquartile 25% (IQ1) | $73,089 | $74,171 |
| Interquartile 75% (IQ3) | $114,543 | $94,093 |
| Interquartile Range (IQR) | $41,455 | $19,922 |
| Standard Deviation (Sample) | $36,453 | $22,128 |
| Standard Deviation (Population) | $36,114 | $21,800 |
Similar Demographics by Median Household Income
Demographics Similar to Immigrants from Austria by Median Household Income
In terms of median household income, the demographic groups most similar to Immigrants from Austria are Immigrants from Czechoslovakia ($95,319, a difference of 0.040%), New Zealander ($95,146, a difference of 0.14%), Soviet Union ($95,098, a difference of 0.19%), Immigrants from Europe ($95,032, a difference of 0.26%), and Korean ($95,018, a difference of 0.27%).
| Demographics | Rating | Rank | Median Household Income |
| Immigrants | Malaysia | 99.9 /100 | #49 | Exceptional $96,292 |
| Bulgarians | 99.9 /100 | #50 | Exceptional $96,290 |
| Estonians | 99.9 /100 | #51 | Exceptional $95,930 |
| Immigrants | South Africa | 99.9 /100 | #52 | Exceptional $95,800 |
| Paraguayans | 99.9 /100 | #53 | Exceptional $95,737 |
| Egyptians | 99.9 /100 | #54 | Exceptional $95,673 |
| Immigrants | Czechoslovakia | 99.9 /100 | #55 | Exceptional $95,319 |
| Immigrants | Austria | 99.9 /100 | #56 | Exceptional $95,277 |
| New Zealanders | 99.8 /100 | #57 | Exceptional $95,146 |
| Soviet Union | 99.8 /100 | #58 | Exceptional $95,098 |
| Immigrants | Europe | 99.8 /100 | #59 | Exceptional $95,032 |
| Koreans | 99.8 /100 | #60 | Exceptional $95,018 |
| Laotians | 99.8 /100 | #61 | Exceptional $94,990 |
| Immigrants | Norway | 99.8 /100 | #62 | Exceptional $94,846 |
| Greeks | 99.8 /100 | #63 | Exceptional $94,735 |
Demographics Similar to Guamanians/Chamorros by Median Household Income
In terms of median household income, the demographic groups most similar to Guamanians/Chamorros are Czech ($86,164, a difference of 0.11%), Irish ($86,145, a difference of 0.13%), Slavic ($86,398, a difference of 0.17%), Luxembourger ($86,418, a difference of 0.19%), and Immigrants from Uzbekistan ($86,425, a difference of 0.20%).
| Demographics | Rating | Rank | Median Household Income |
| Carpatho Rusyns | 72.8 /100 | #155 | Good $86,635 |
| Immigrants | Albania | 71.5 /100 | #156 | Good $86,534 |
| Samoans | 71.0 /100 | #157 | Good $86,498 |
| Moroccans | 70.6 /100 | #158 | Good $86,468 |
| Immigrants | Uzbekistan | 70.1 /100 | #159 | Good $86,425 |
| Luxembourgers | 70.0 /100 | #160 | Good $86,418 |
| Slavs | 69.7 /100 | #161 | Good $86,398 |
| Guamanians/Chamorros | 67.7 /100 | #162 | Good $86,255 |
| Czechs | 66.4 /100 | #163 | Good $86,164 |
| Irish | 66.2 /100 | #164 | Good $86,145 |
| Norwegians | 65.3 /100 | #165 | Good $86,084 |
| Scandinavians | 65.1 /100 | #166 | Good $86,073 |
| Immigrants | Immigrants | 61.3 /100 | #167 | Good $85,818 |
| Icelanders | 61.0 /100 | #168 | Good $85,797 |
| Colombians | 59.7 /100 | #169 | Average $85,716 |