Immigrants from Austria vs Mongolian Median Household Income
COMPARE
Immigrants from Austria
Mongolian
Median Household Income
Median Household Income Comparison
Immigrants from Austria
Mongolians
$95,277
MEDIAN HOUSEHOLD INCOME
99.9/ 100
METRIC RATING
56th/ 347
METRIC RANK
$93,971
MEDIAN HOUSEHOLD INCOME
99.7/ 100
METRIC RATING
68th/ 347
METRIC RANK
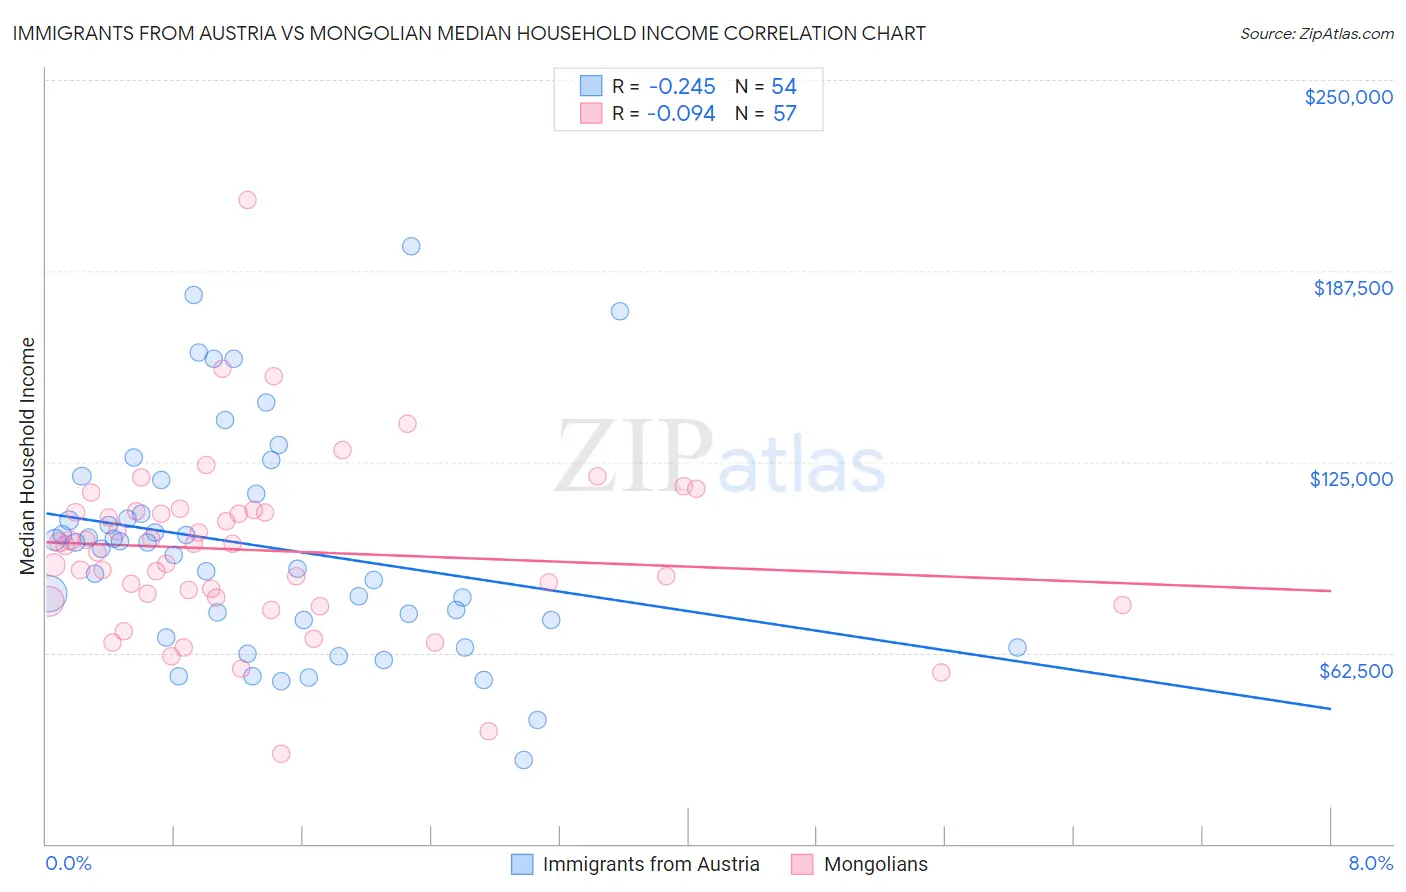
Immigrants from Austria vs Mongolian Median Household Income Correlation Chart
The statistical analysis conducted on geographies consisting of 167,955,679 people shows a weak negative correlation between the proportion of Immigrants from Austria and median household income in the United States with a correlation coefficient (R) of -0.245 and weighted average of $95,277. Similarly, the statistical analysis conducted on geographies consisting of 140,276,403 people shows a slight negative correlation between the proportion of Mongolians and median household income in the United States with a correlation coefficient (R) of -0.094 and weighted average of $93,971, a difference of 1.4%.
Median Household Income Correlation Summary
| Measurement | Immigrants from Austria | Mongolian |
| Minimum | $27,500 | $29,643 |
| Maximum | $195,784 | $210,785 |
| Range | $168,284 | $181,142 |
| Mean | $97,293 | $96,039 |
| Median | $97,556 | $97,648 |
| Interquartile 25% (IQ1) | $73,089 | $79,996 |
| Interquartile 75% (IQ3) | $114,543 | $108,680 |
| Interquartile Range (IQR) | $41,455 | $28,684 |
| Standard Deviation (Sample) | $36,453 | $28,830 |
| Standard Deviation (Population) | $36,114 | $28,576 |
Demographics Similar to Immigrants from Austria and Mongolians by Median Household Income
In terms of median household income, the demographic groups most similar to Immigrants from Austria are Immigrants from Czechoslovakia ($95,319, a difference of 0.040%), New Zealander ($95,146, a difference of 0.14%), Soviet Union ($95,098, a difference of 0.19%), Immigrants from Europe ($95,032, a difference of 0.26%), and Korean ($95,018, a difference of 0.27%). Similarly, the demographic groups most similar to Mongolians are Argentinean ($93,960, a difference of 0.010%), Immigrants from Fiji ($93,933, a difference of 0.040%), Immigrants from Philippines ($93,899, a difference of 0.080%), Immigrants from Scotland ($94,091, a difference of 0.13%), and Lithuanian ($93,852, a difference of 0.13%).
| Demographics | Rating | Rank | Median Household Income |
| Immigrants | South Africa | 99.9 /100 | #52 | Exceptional $95,800 |
| Paraguayans | 99.9 /100 | #53 | Exceptional $95,737 |
| Egyptians | 99.9 /100 | #54 | Exceptional $95,673 |
| Immigrants | Czechoslovakia | 99.9 /100 | #55 | Exceptional $95,319 |
| Immigrants | Austria | 99.9 /100 | #56 | Exceptional $95,277 |
| New Zealanders | 99.8 /100 | #57 | Exceptional $95,146 |
| Soviet Union | 99.8 /100 | #58 | Exceptional $95,098 |
| Immigrants | Europe | 99.8 /100 | #59 | Exceptional $95,032 |
| Koreans | 99.8 /100 | #60 | Exceptional $95,018 |
| Laotians | 99.8 /100 | #61 | Exceptional $94,990 |
| Immigrants | Norway | 99.8 /100 | #62 | Exceptional $94,846 |
| Greeks | 99.8 /100 | #63 | Exceptional $94,735 |
| Immigrants | Netherlands | 99.7 /100 | #64 | Exceptional $94,411 |
| Immigrants | Belarus | 99.7 /100 | #65 | Exceptional $94,399 |
| Immigrants | Romania | 99.7 /100 | #66 | Exceptional $94,222 |
| Immigrants | Scotland | 99.7 /100 | #67 | Exceptional $94,091 |
| Mongolians | 99.7 /100 | #68 | Exceptional $93,971 |
| Argentineans | 99.7 /100 | #69 | Exceptional $93,960 |
| Immigrants | Fiji | 99.7 /100 | #70 | Exceptional $93,933 |
| Immigrants | Philippines | 99.6 /100 | #71 | Exceptional $93,899 |
| Lithuanians | 99.6 /100 | #72 | Exceptional $93,852 |