Immigrants from Armenia vs Immigrants from Bangladesh Median Family Income
COMPARE
Immigrants from Armenia
Immigrants from Bangladesh
Median Family Income
Median Family Income Comparison
Immigrants from Armenia
Immigrants from Bangladesh
$97,605
MEDIAN FAMILY INCOME
7.0/ 100
METRIC RATING
213th/ 347
METRIC RANK
$94,665
MEDIAN FAMILY INCOME
1.6/ 100
METRIC RATING
233rd/ 347
METRIC RANK
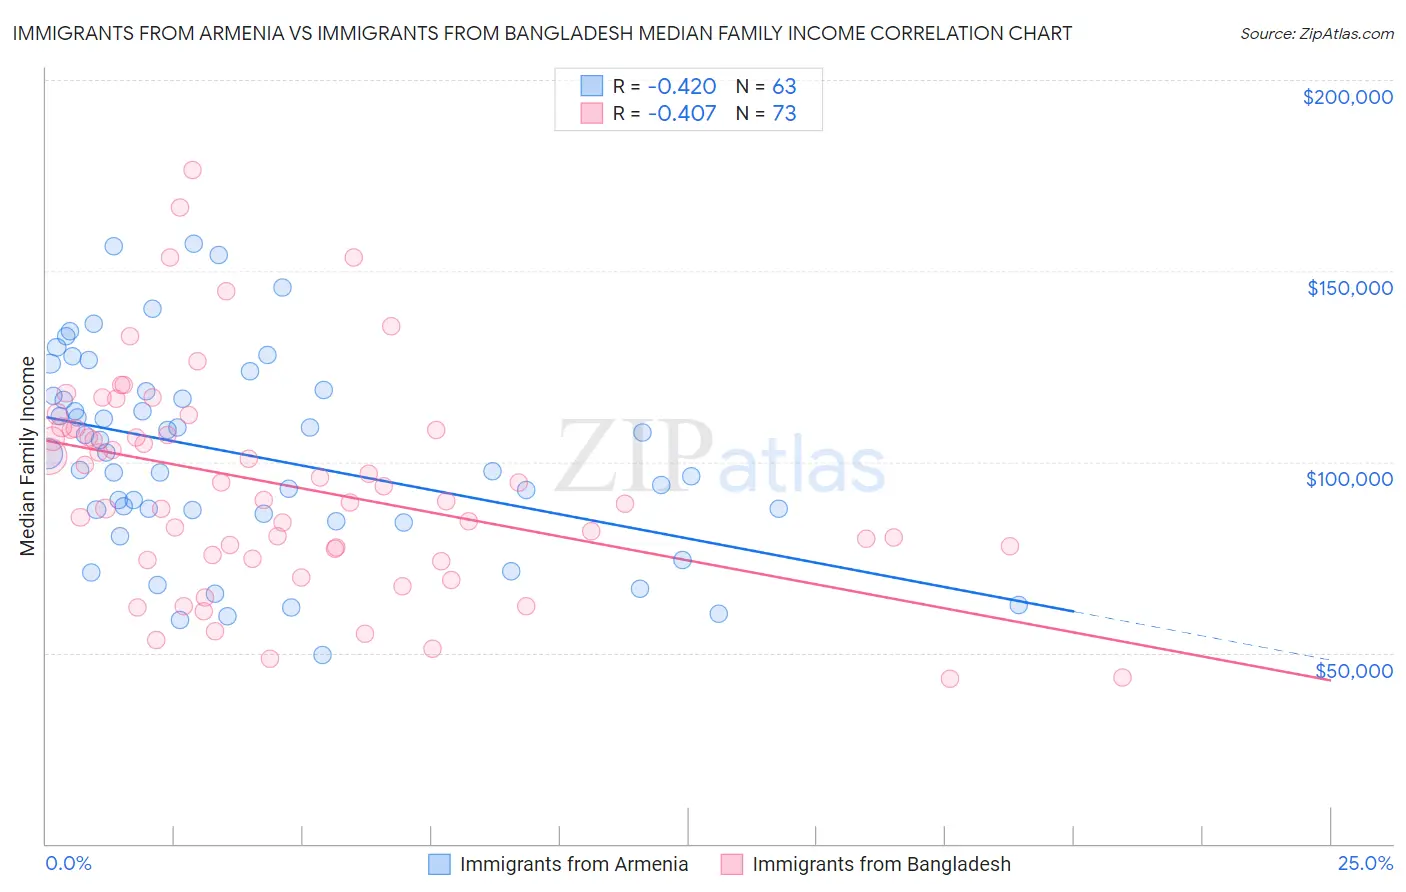
Immigrants from Armenia vs Immigrants from Bangladesh Median Family Income Correlation Chart
The statistical analysis conducted on geographies consisting of 97,713,870 people shows a moderate negative correlation between the proportion of Immigrants from Armenia and median family income in the United States with a correlation coefficient (R) of -0.420 and weighted average of $97,605. Similarly, the statistical analysis conducted on geographies consisting of 203,503,484 people shows a moderate negative correlation between the proportion of Immigrants from Bangladesh and median family income in the United States with a correlation coefficient (R) of -0.407 and weighted average of $94,665, a difference of 3.1%.
Median Family Income Correlation Summary
| Measurement | Immigrants from Armenia | Immigrants from Bangladesh |
| Minimum | $49,583 | $43,315 |
| Maximum | $157,199 | $176,322 |
| Range | $107,616 | $133,007 |
| Mean | $101,713 | $93,798 |
| Median | $102,061 | $90,050 |
| Interquartile 25% (IQ1) | $86,292 | $75,060 |
| Interquartile 75% (IQ3) | $118,550 | $108,612 |
| Interquartile Range (IQR) | $32,258 | $33,553 |
| Standard Deviation (Sample) | $25,932 | $28,054 |
| Standard Deviation (Population) | $25,725 | $27,861 |
Demographics Similar to Immigrants from Armenia and Immigrants from Bangladesh by Median Family Income
In terms of median family income, the demographic groups most similar to Immigrants from Armenia are Bermudan ($97,577, a difference of 0.030%), Nigerian ($97,522, a difference of 0.090%), Immigrants from Bosnia and Herzegovina ($97,432, a difference of 0.18%), Japanese ($97,288, a difference of 0.33%), and Immigrants from Cambodia ($97,222, a difference of 0.39%). Similarly, the demographic groups most similar to Immigrants from Bangladesh are Immigrants from Venezuela ($94,904, a difference of 0.25%), Ecuadorian ($95,114, a difference of 0.47%), Malaysian ($95,230, a difference of 0.60%), Marshallese ($95,293, a difference of 0.66%), and Immigrants from the Azores ($95,402, a difference of 0.78%).
| Demographics | Rating | Rank | Median Family Income |
| Immigrants | Armenia | 7.0 /100 | #213 | Tragic $97,605 |
| Bermudans | 6.9 /100 | #214 | Tragic $97,577 |
| Nigerians | 6.7 /100 | #215 | Tragic $97,522 |
| Immigrants | Bosnia and Herzegovina | 6.4 /100 | #216 | Tragic $97,432 |
| Japanese | 6.0 /100 | #217 | Tragic $97,288 |
| Immigrants | Cambodia | 5.8 /100 | #218 | Tragic $97,222 |
| Delaware | 5.1 /100 | #219 | Tragic $96,958 |
| Sudanese | 4.7 /100 | #220 | Tragic $96,783 |
| Immigrants | Ghana | 4.2 /100 | #221 | Tragic $96,544 |
| Immigrants | Nigeria | 4.0 /100 | #222 | Tragic $96,439 |
| Venezuelans | 3.7 /100 | #223 | Tragic $96,281 |
| Immigrants | Nonimmigrants | 3.6 /100 | #224 | Tragic $96,231 |
| Vietnamese | 3.4 /100 | #225 | Tragic $96,123 |
| Immigrants | Panama | 2.7 /100 | #226 | Tragic $95,647 |
| Alaska Natives | 2.6 /100 | #227 | Tragic $95,573 |
| Immigrants | Azores | 2.4 /100 | #228 | Tragic $95,402 |
| Marshallese | 2.2 /100 | #229 | Tragic $95,293 |
| Malaysians | 2.2 /100 | #230 | Tragic $95,230 |
| Ecuadorians | 2.1 /100 | #231 | Tragic $95,114 |
| Immigrants | Venezuela | 1.9 /100 | #232 | Tragic $94,904 |
| Immigrants | Bangladesh | 1.6 /100 | #233 | Tragic $94,665 |