Immigrants from Albania vs Immigrants from Jordan 7th Grade
COMPARE
Immigrants from Albania
Immigrants from Jordan
7th Grade
7th Grade Comparison
Immigrants from Albania
Immigrants from Jordan
96.0%
7TH GRADE
50.4/ 100
METRIC RATING
173rd/ 347
METRIC RANK
96.2%
7TH GRADE
77.0/ 100
METRIC RATING
155th/ 347
METRIC RANK
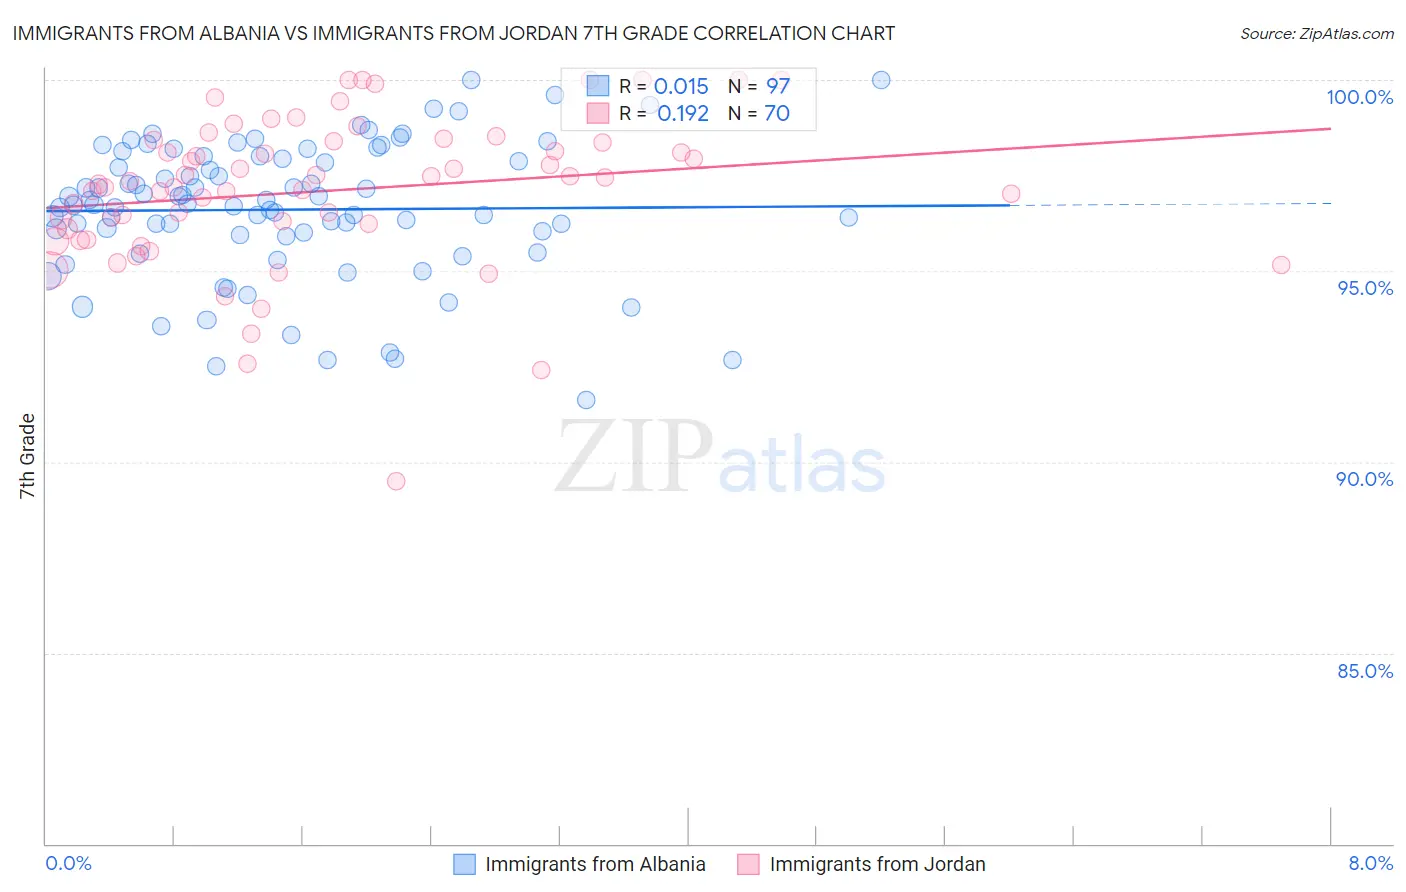
Immigrants from Albania vs Immigrants from Jordan 7th Grade Correlation Chart
The statistical analysis conducted on geographies consisting of 119,265,453 people shows no correlation between the proportion of Immigrants from Albania and percentage of population with at least 7th grade education in the United States with a correlation coefficient (R) of 0.015 and weighted average of 96.0%. Similarly, the statistical analysis conducted on geographies consisting of 181,269,353 people shows a poor positive correlation between the proportion of Immigrants from Jordan and percentage of population with at least 7th grade education in the United States with a correlation coefficient (R) of 0.192 and weighted average of 96.2%, a difference of 0.18%.
7th Grade Correlation Summary
| Measurement | Immigrants from Albania | Immigrants from Jordan |
| Minimum | 91.6% | 89.5% |
| Maximum | 100.0% | 100.0% |
| Range | 8.4% | 10.5% |
| Mean | 96.6% | 97.1% |
| Median | 96.7% | 97.3% |
| Interquartile 25% (IQ1) | 95.9% | 96.1% |
| Interquartile 75% (IQ3) | 98.0% | 98.4% |
| Interquartile Range (IQR) | 2.0% | 2.3% |
| Standard Deviation (Sample) | 1.8% | 2.0% |
| Standard Deviation (Population) | 1.8% | 2.0% |
Demographics Similar to Immigrants from Albania and Immigrants from Jordan by 7th Grade
In terms of 7th grade, the demographic groups most similar to Immigrants from Albania are Mongolian (96.0%, a difference of 0.0%), Venezuelan (96.0%, a difference of 0.010%), Egyptian (96.1%, a difference of 0.020%), Ute (96.1%, a difference of 0.030%), and Immigrants from Ukraine (96.1%, a difference of 0.030%). Similarly, the demographic groups most similar to Immigrants from Jordan are Immigrants from Israel (96.2%, a difference of 0.0%), Kenyan (96.2%, a difference of 0.010%), Ugandan (96.2%, a difference of 0.010%), Arab (96.2%, a difference of 0.070%), and Alsatian (96.1%, a difference of 0.080%).
| Demographics | Rating | Rank | 7th Grade |
| Immigrants | Israel | 77.6 /100 | #154 | Good 96.2% |
| Immigrants | Jordan | 77.0 /100 | #155 | Good 96.2% |
| Kenyans | 76.2 /100 | #156 | Good 96.2% |
| Ugandans | 75.5 /100 | #157 | Good 96.2% |
| Arabs | 68.6 /100 | #158 | Good 96.2% |
| Alsatians | 67.2 /100 | #159 | Good 96.1% |
| Immigrants | Kenya | 66.8 /100 | #160 | Good 96.1% |
| Bermudans | 66.3 /100 | #161 | Good 96.1% |
| Pima | 64.3 /100 | #162 | Good 96.1% |
| Spaniards | 62.6 /100 | #163 | Good 96.1% |
| Immigrants | Italy | 62.1 /100 | #164 | Good 96.1% |
| Immigrants | Taiwan | 61.5 /100 | #165 | Good 96.1% |
| Immigrants | Kazakhstan | 61.0 /100 | #166 | Good 96.1% |
| Immigrants | Sri Lanka | 59.9 /100 | #167 | Average 96.1% |
| Immigrants | Poland | 59.0 /100 | #168 | Average 96.1% |
| Ute | 55.8 /100 | #169 | Average 96.1% |
| Immigrants | Ukraine | 55.0 /100 | #170 | Average 96.1% |
| Egyptians | 54.2 /100 | #171 | Average 96.1% |
| Venezuelans | 51.4 /100 | #172 | Average 96.0% |
| Immigrants | Albania | 50.4 /100 | #173 | Average 96.0% |
| Mongolians | 50.0 /100 | #174 | Average 96.0% |