Immigrants from Albania vs Creek Median Household Income
COMPARE
Immigrants from Albania
Creek
Median Household Income
Median Household Income Comparison
Immigrants from Albania
Creek
$86,534
MEDIAN HOUSEHOLD INCOME
71.5/ 100
METRIC RATING
156th/ 347
METRIC RANK
$67,715
MEDIAN HOUSEHOLD INCOME
0.0/ 100
METRIC RATING
333rd/ 347
METRIC RANK
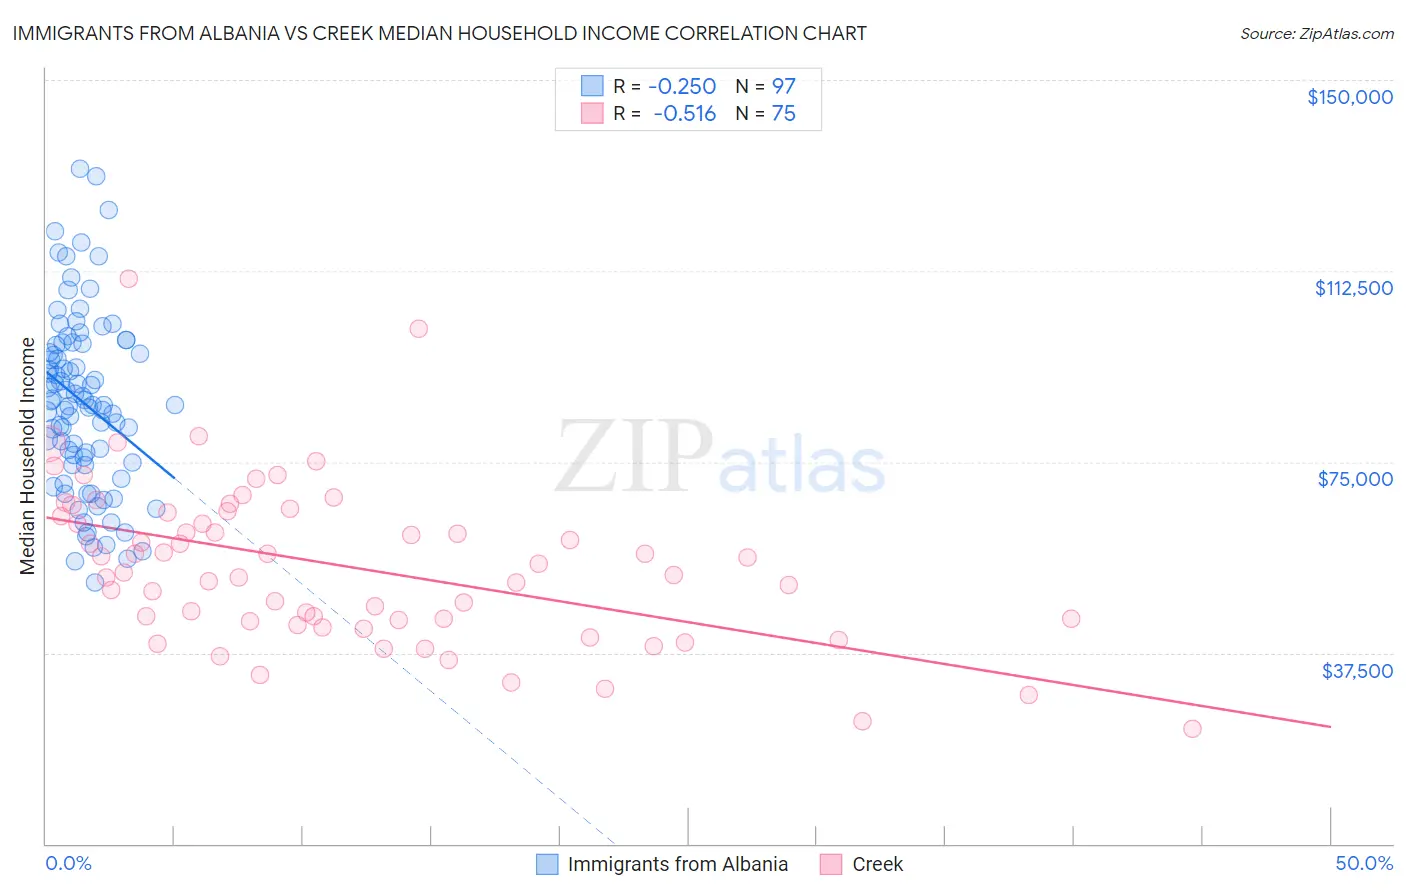
Immigrants from Albania vs Creek Median Household Income Correlation Chart
The statistical analysis conducted on geographies consisting of 119,343,332 people shows a weak negative correlation between the proportion of Immigrants from Albania and median household income in the United States with a correlation coefficient (R) of -0.250 and weighted average of $86,534. Similarly, the statistical analysis conducted on geographies consisting of 178,405,677 people shows a substantial negative correlation between the proportion of Creek and median household income in the United States with a correlation coefficient (R) of -0.516 and weighted average of $67,715, a difference of 27.8%.
Median Household Income Correlation Summary
| Measurement | Immigrants from Albania | Creek |
| Minimum | $51,316 | $22,500 |
| Maximum | $132,457 | $111,063 |
| Range | $81,141 | $88,563 |
| Mean | $86,652 | $54,543 |
| Median | $86,175 | $53,166 |
| Interquartile 25% (IQ1) | $74,686 | $43,621 |
| Interquartile 75% (IQ3) | $98,070 | $65,130 |
| Interquartile Range (IQR) | $23,384 | $21,509 |
| Standard Deviation (Sample) | $17,379 | $15,915 |
| Standard Deviation (Population) | $17,290 | $15,809 |
Similar Demographics by Median Household Income
Demographics Similar to Immigrants from Albania by Median Household Income
In terms of median household income, the demographic groups most similar to Immigrants from Albania are Samoan ($86,498, a difference of 0.040%), Moroccan ($86,468, a difference of 0.080%), Carpatho Rusyn ($86,635, a difference of 0.12%), Immigrants from Uzbekistan ($86,425, a difference of 0.13%), and Luxembourger ($86,418, a difference of 0.13%).
| Demographics | Rating | Rank | Median Household Income |
| Immigrants | Nepal | 77.7 /100 | #149 | Good $87,046 |
| Basques | 77.2 /100 | #150 | Good $87,001 |
| Hungarians | 76.3 /100 | #151 | Good $86,920 |
| Immigrants | Saudi Arabia | 75.8 /100 | #152 | Good $86,875 |
| South Americans | 75.1 /100 | #153 | Good $86,824 |
| Immigrants | Germany | 74.4 /100 | #154 | Good $86,764 |
| Carpatho Rusyns | 72.8 /100 | #155 | Good $86,635 |
| Immigrants | Albania | 71.5 /100 | #156 | Good $86,534 |
| Samoans | 71.0 /100 | #157 | Good $86,498 |
| Moroccans | 70.6 /100 | #158 | Good $86,468 |
| Immigrants | Uzbekistan | 70.1 /100 | #159 | Good $86,425 |
| Luxembourgers | 70.0 /100 | #160 | Good $86,418 |
| Slavs | 69.7 /100 | #161 | Good $86,398 |
| Guamanians/Chamorros | 67.7 /100 | #162 | Good $86,255 |
| Czechs | 66.4 /100 | #163 | Good $86,164 |
Demographics Similar to Creek by Median Household Income
In terms of median household income, the demographic groups most similar to Creek are Sioux ($67,792, a difference of 0.11%), Black/African American ($67,573, a difference of 0.21%), Native/Alaskan ($67,879, a difference of 0.24%), Arapaho ($67,965, a difference of 0.37%), and Dutch West Indian ($68,412, a difference of 1.0%).
| Demographics | Rating | Rank | Median Household Income |
| Yuman | 0.0 /100 | #326 | Tragic $68,743 |
| Immigrants | Cuba | 0.0 /100 | #327 | Tragic $68,461 |
| Menominee | 0.0 /100 | #328 | Tragic $68,423 |
| Dutch West Indians | 0.0 /100 | #329 | Tragic $68,412 |
| Arapaho | 0.0 /100 | #330 | Tragic $67,965 |
| Natives/Alaskans | 0.0 /100 | #331 | Tragic $67,879 |
| Sioux | 0.0 /100 | #332 | Tragic $67,792 |
| Creek | 0.0 /100 | #333 | Tragic $67,715 |
| Blacks/African Americans | 0.0 /100 | #334 | Tragic $67,573 |
| Cheyenne | 0.0 /100 | #335 | Tragic $66,974 |
| Immigrants | Congo | 0.0 /100 | #336 | Tragic $66,768 |
| Kiowa | 0.0 /100 | #337 | Tragic $65,914 |
| Immigrants | Yemen | 0.0 /100 | #338 | Tragic $65,194 |
| Hopi | 0.0 /100 | #339 | Tragic $65,043 |
| Pueblo | 0.0 /100 | #340 | Tragic $64,692 |